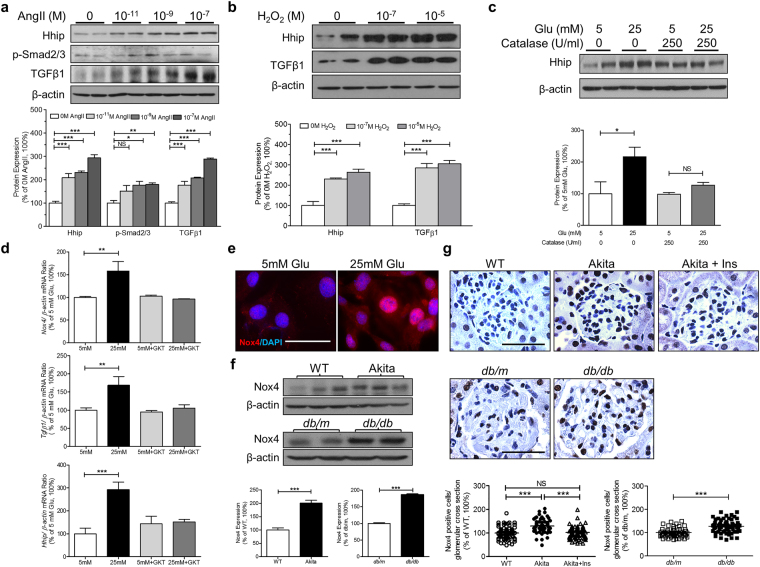
Figure 3.
The interaction of Hhip and Nox4 in vitro and in vivo. (a–c) WB in mECs. (a) Ang II dose-dependent manner. (b) H2O2 dose-dependent manner. (c) High glucose ± Catalase (250U/ml) on Hhip protein expression. *P ≤ 0.05; **P ≤ 0.01; ***P ≤ 0.001; NS, non-significant vs. mECs cultured in 5 mM glucose (100%); Values represent the mean ± SEM. (d) qPCR of Nox4, TGFβ1 and Hhip- mRNA expression in mECs. mRNA of genes were normalized by their corresponding β-actin mRNA. **P ≤ 0.01; ***P ≤ 0.001; NS, non-significant vs. mECs cultured in 5 mM glucose (100%); Values represent the mean ± SEM. (e) Nox4-IF staining in mECs (scale bar, 50 µm). (f) WB of Nox4 protein expression in renal cortex of Akita and db/db mice at the age of 20 weeks. ***P ≤ 0.001 vs. WT or db/m; Values represent the mean ± SEM. (g) Nox4-IHC in the kidneys of Akita and db/db mice at the age of 20 weeks (scale bar, 50 µm). Semi-quantification of Nox4 positive stained cells per glomerulus. ***P ≤ 0.001; NS, non-significant.

