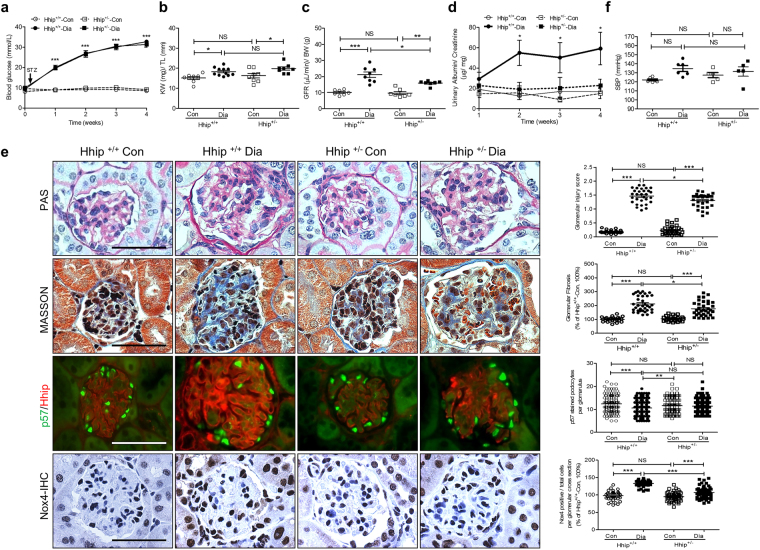
Figure 6.
4 weeks of LDSTZ-induced diabetic model in male Hhip+/+ and Hhip+/− mice from the age of 12 to 16 weeks. (a) Glycemia measurement. (b) Ratio of KW/TL. (c) GFR measurement. (d) Urinary ACR measurement. (e) Renal morphology. PAS staining (scale bar, 50 µm) with semi-quantification of glomerulosclerosis injury score. Grade 0, normal glomeruli; Grade 1, presence of mesangial expansion/thickening of the basement membrane; Grade 2, mild/moderate segmental hyalinosis/sclerosis involving less than 50% total glomerular area; Masson staining (scale bar, 50 µm) with semi-quantification of glomerular fibrosis; p57/Hhip co-IF staining with semi-quantification of p57 positive stained cells per glomerulus. Nox4-IHC staining with semi-quantification of Nox4 positive stained cells per glomerulus. (f) SBP (mmHg) measurement. NS, non-significant vs. Hhip+/+-Con; Values represent the mean ± SEM.

