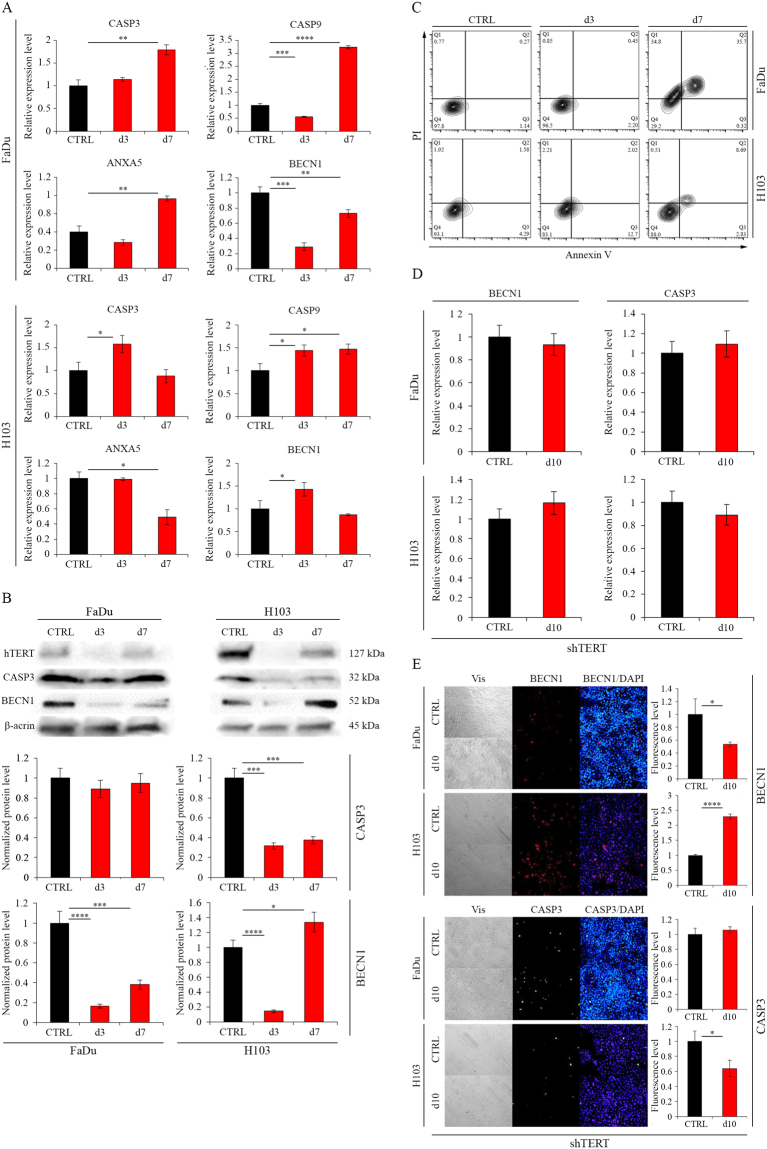
Figure 3.
Analysis of cell death mechanism after hTERT gene knockdown in HNSCC cell lines. (A) siRNA - Analysis of apoptosis- and autophagy-related genes expression at the transcriptional level with qPCR; (B) siRNA - Analysis of apoptosis- and autophagy-related genes expression at the protein level by Western blot analysis. Semi-quantitative analysis of Western blot results using ImageJ software; (C) Apoptosis analysis by flow cytometry; (D) shRNA - Analysis of apoptosis- and autophagy-related genes expression at the transcriptional level with qPCR; (E) shRNA - Analysis of apoptosis- and autophagy-related genes expression at the protein level by immunofluorescence staining, objective magnification 20x. CTRL – control cells transfected with non-specific siRNA/cells transduced with control lentiviral vector; siTERT – cells transfected with hTERT gene-targeted siRNA on day 3rd and 7th; shTERT – cells transduced with lentiviral vectors containing shRNA on day 10th. Data are presented as the mean ± standard deviation. *P < 0.05, **P < 0.01, ***P < 0.001, ****P < 0.0001 with comparisons indicated by lines.

