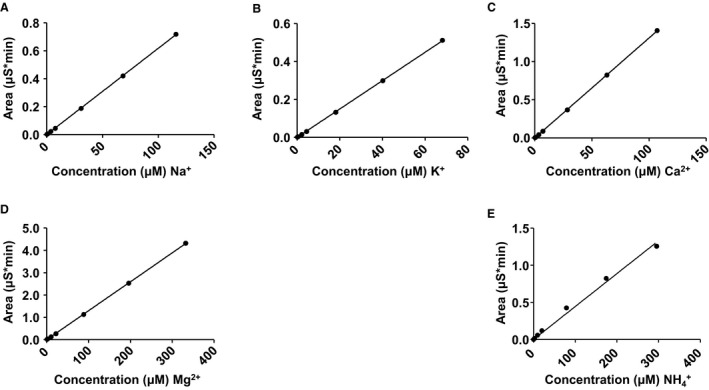
Figure 2.

Cation standard curves. (A) Sodium (Na+) standard curve. (B) Potassium (K+) standard curve. (C) Calcium (Ca2+) standard curve. (D) Magnesium (Mg2+) standard curve. (E) Ammonium (NH 4 +) standard curve. A linear regression line was fitted to each standard curve and unknown cation concentrations determined from the slope of the line.
