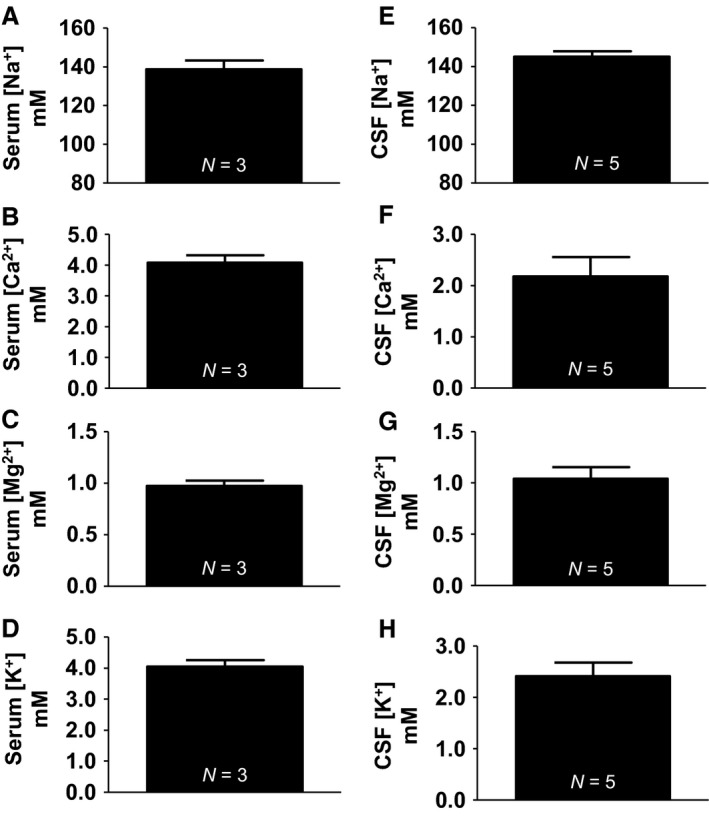
Figure 4.

Cation concentrations from serum and CSF. (A) Serum sodium (138.8 ± 4.56 mmol/L). (B) Serum potassium (4.05 ± 0.21 mmol/L). (C) Serum calcium (4.07 ± 0.26 mmol/L). (D) Serum magnesium (0.98 ± 0.05 mmol/L). (E) CSF sodium (145.1 ± 2.81 mmol/L). (F) CSF potassium (2.41 ± 0.26 mmol/L). (G) CSF calcium (2.18 ± 0.38 mmol/L). (H) CSF magnesium (1.04 ± 0.11 mmol/L).
