Figure 7.

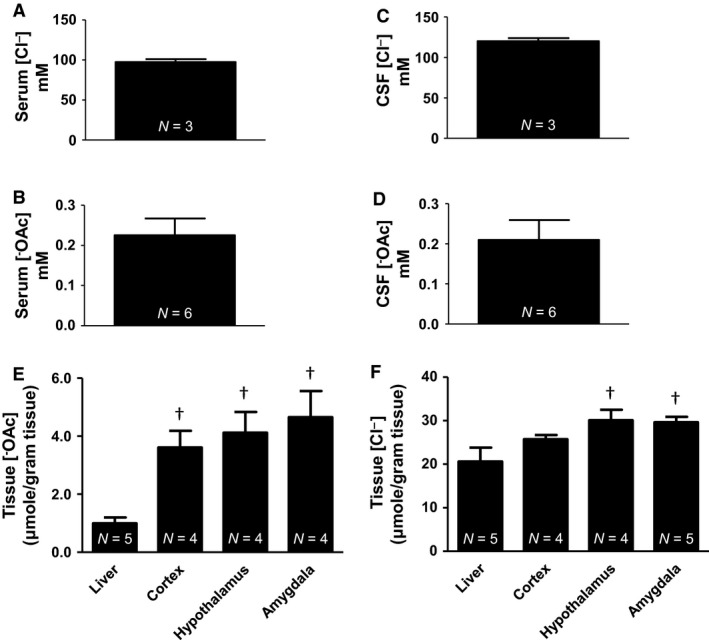
Summary data for anions. (A) Serum Cl− (97.7 ± 3.42 mmol/L). (B) Serum − OAc (0.23 ± 0.04 mmol/L). (C) CSF Cl− (120.2 ± 2.81 mmol/L). (D) CSF − OAc (0.21 ± 0.05 mmol/L). (E) Tissue − OAc (μmol/gram tissue): Liver (1.00 ± 0.19), cortex (3.61 ± 0.58), hypothalamus (4.12 ± 0.72), and amygdala (4.65 ± 0.90). (F) Tissue Cl− (μmol/gram tissue): Liver (20.57 ± 3.20), cortex (25.72 ± 0.95), hypothalamus (30.09 ± 2.40), and amygdala (29.61 ± 1.25). (†vs. liver one‐way ANOVA).
