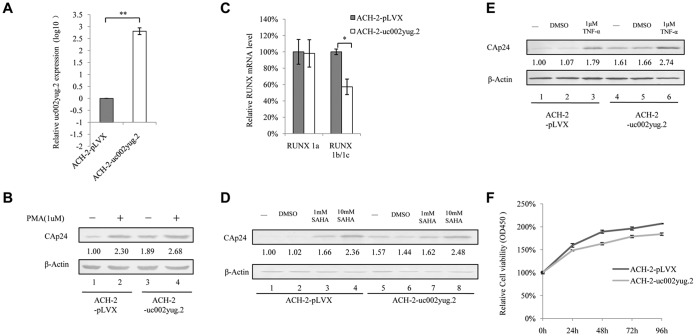
FIG 5.
Expression of uc002yug.2 activates latent HIV-1 replication. (A) ACH-2 cells were infected with lentiviruses containing uc002yug.2 or a scramble control, and at 48 h postinfection, puromycin (1 μg/ml) was added to the medium for selection. The expression of uc002yug.2 was determined by qRT-PCR. (B) uc002yug.2-overexpressing or control ACH-2 cells were treated or not with PMA (1 μM), and CAp24 levels were detected by immunoblotting 48 h posttreatment. The densities of bands were analyzed with ImageJ software to calculate the values relative to that for β-actin. (C) Expression levels of RUNX1a and RUNX1b and -1c were determined by qRT-PCR when uc002yug.2 was overexpressed in ACH-2 cells. (D and E) CAp24 levels were detected by immunoblotting 48 h after uc002yug.2-overexpressing or control ACH-2 cells were treated or not with different concentrations of SAHA (0, 1, and 10 mM) (D) or TNF-α (1 μM) (E) for 48 h. The densities of bands were analyzed with ImageJ software to calculate the values relative to that for β-actin. (F) uc002yug.2-overexpressing or control ACH-2 cells at a concentration of 1 × 10³ per well were seeded in a 96-well plate. Cell growth was measured using Cell Counting Kit-8 (Transgen, China) according to the manufacturer's instructions at 24 h, 48 h, 72 h, and 96 h. Cell proliferation curves were plotted based on the absorbance at 450 nm using an iMark microplate reader (Bio-Rad) at each time point. The absorbance value at 0 h was set as 100%. Results are representative of those from three independent repeats. Data are presented as means ± SDs.

