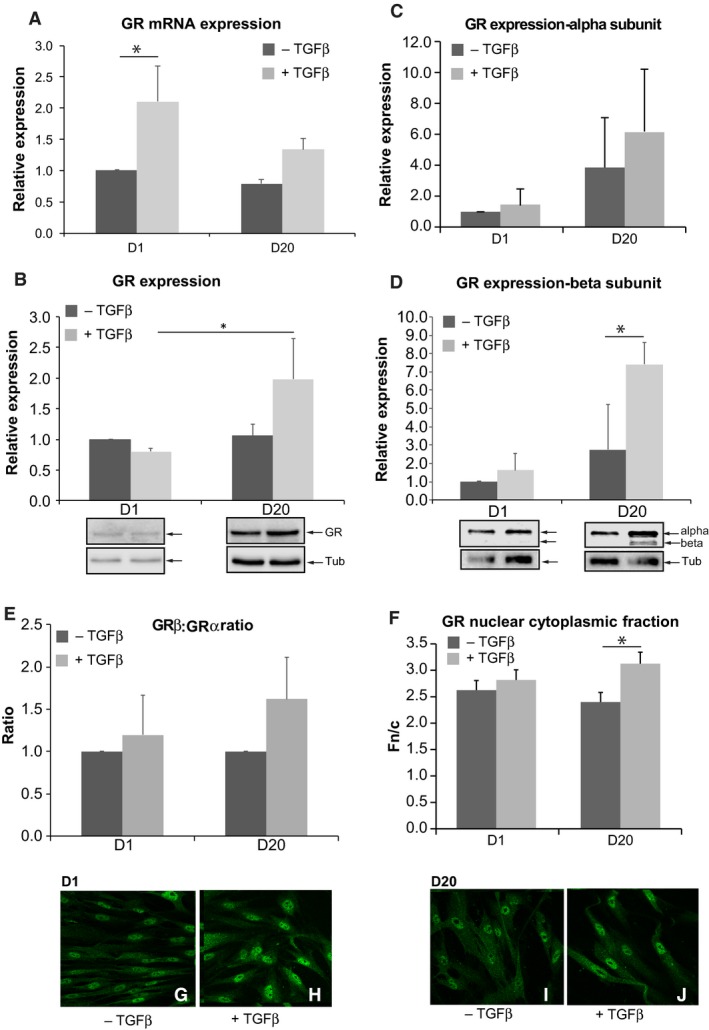
Figure 3.

Glucocorticoid receptor expression in fibroblast and myofibroblast following TGF β treatment. (A) Graph shows the relative expression of glucocorticoid receptor (GR) mRNA in fibroblast and myofibroblast in TGF β‐untreated and ‐treated cells. +TGF β: TGF β‐treated cells; ‐TGF β: TGF β‐untreated cells. Data are mean ± SEM from three independent experiments; *P < 0.05. (B) Graph shows the relative expression of GR proteins in fibroblast and myofibroblast in TGF β‐untreated and ‐treated cells. Below the graph, representative western blots are illustrated for the different experimental conditions; Tub = tubulin used as loading control. +TGF β: TGF β‐treated cells; ‐ TGF β: TGF β‐untreated cells. Data are mean ± SEM from three independent experiments; *P < 0.05. (C and D) Graphs show GR alpha subunit (C) and beta subunit (D) in fibroblast and myofibroblast in TGF β‐untreated and ‐treated cells. The representative western blot for both isoforms is illustrated below (D). +TGF β: TGF β‐treated cells; ‐ TGF β: TGF β‐untreated cells. Data shown are mean ± SEM from three independent experiments; *P < 0.05. (E) Graph shows the ratio of GR β:GR α isoforms for each experimental condition. Note that TGF β increases GR β isoform. Data were normalized to D1 –TGF β. +TGF β: TGF β‐treated cells; ‐ TGF β: TGF β‐untreated cells. (F) Graph shows the relative fluorescence in the nucleus compared to that in the cytoplasm (Fn/c) of GR in both fibroblast and myofibroblast cells in different experimental conditions. Note the increased Fn/c at D20 in presence of TGF β. Each datapoint represents mean ± SEM of data from 40 cells; *P < 0.05. +TGF β: TGF β‐treated cells; ‐ TGF β: TGF β‐untreated cells. (G–J) Immunofluorescence images for GR expression in different experimental conditions: at D1–TGF β (G), at D1+TGF β (H), at D20–TGF β (I), at D20+TGF β (J).
