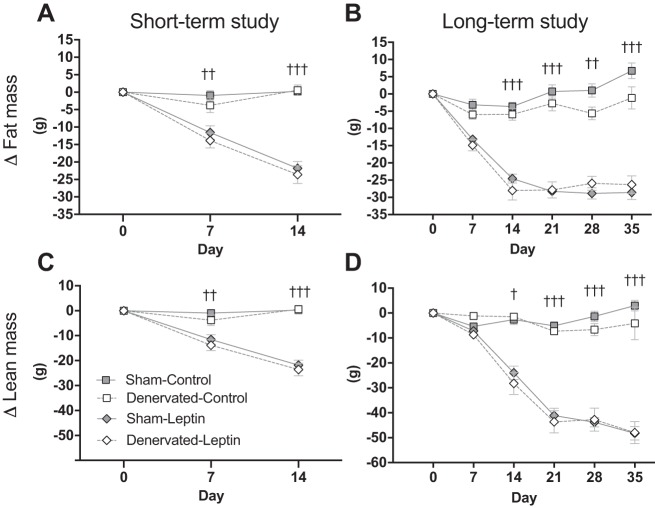
Fig. 5.
Weekly changes in fat mass and lean mass. A and B: fat mass was assessed on a weekly basis by time-domain (TD)-NMR and weekly changes in Δfat mass were calculated by subtracting absolute fat mass recorded at day 0 from absolute fat mass recorded at days 0, 7, 14, 21, 28, and 35. In the short-term study, Δfat mass in Sham-Leptin (n = 8) and Denervated-Leptin (n = 8) was different than their respective Control group (n = 7 for Sham and n = 8 for Denervated-Control) at days 7 and 14 (P < 0.01). In the long-term study, Δfat mass in Sham-Leptin and Denervated-Leptin was different than their respective Control group by day 14 and differences persisted until day 35 (P < 0.01). C and D: lean mass was assessed on a weekly basis by TD-NMR and weekly changes in Δlean mass were calculated by subtracting absolute lean mass recorded at day 0 from absolute lean mass recorded at days 0, 7, 14, 21, 28, and 35. Similar to Δfat mass, Δlean mass differed between Leptin and respective Control group in both studies. In the short-term study, differences were observed starting day 7 (P < 0.01) whereas in the long-term study, differences were detected starting day 14 (P < 0.05). Differences in Δlean mass remained statistically significant until the end of each study. †P < 0.05, ††P < 0.01, †††P < 0.001, significant difference between Leptin and respective Control groups. Short-term study: Sham-Control (n = 7), Sham-Leptin, Denervated-Control, and Denervated-Leptin (n = 8/group). Long-term study: Sham-Control (n = 8), Sham-Leptin (n = 10), Denervated-Control (n = 8), and Denervated-Leptin (n = 9).

