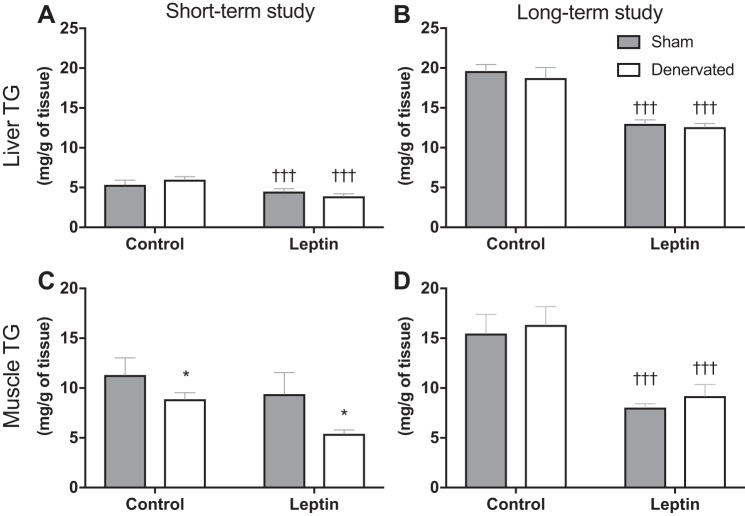
Fig. 6.
Tissue triglyceride (TG) content. A and B: liver TG content was measured at the end point of the short-term and the long-term study, respectively. In both studies, liver TG content was significantly lower in Leptin groups relative to their Control groups. C and D: muscle TG content was measured at the end point of the short-term and the long-term study, respectively. A significant effect of Leptin was observed in the long-term study but not in the short-term study. In the short-term study, Denervated animals exhibited significantly lower levels of muscle TG than respective Sham animals. †††P < 0.001, significant difference between Leptin and respective Control groups. *P < 0.05, significant difference between Sham and respective Denervated groups. Short-term study: Sham-Control (n = 7), Sham-Leptin, Denervated-Control, and Denervated-Leptin (n = 8/group). Long-term study: Sham-Control (n = 8), Sham-Leptin (n = 10), Denervated-Control (n = 8), and Denervated-Leptin (n = 9).

