Fig. 8.
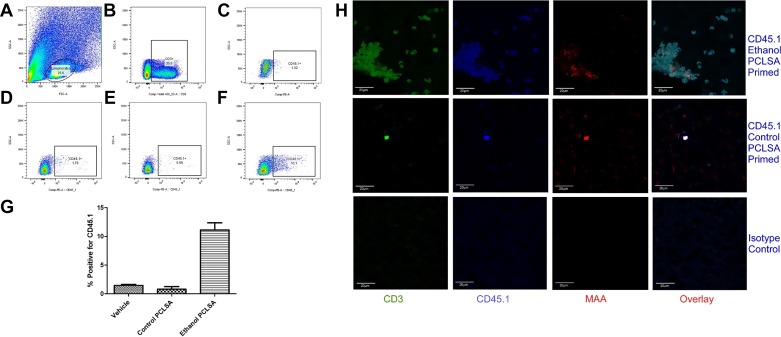
Identification of CD45.1/CD45.2 T cells in livers of naïve mice. CD45.1 T cells from control- and ethanol-PCLSA-immunized CD45.1 mice were isolated and transferred into naïve CD45.2-expressing mice at a concentration of 1 × 10⁶ cells/mouse for 4 days. CD3+ T cells were isolated from the liver and analyzed by flow cytometry. A: gating of lymphocytes from total liver cell population. B: gating of CD3+ T cells. C: gating of CD45.1 cells in isotype control. D: gating of CD45.1 cells from saline-injected mice. E: gating of CD45.1 cells from control-PCLSA-immunized mice. F: gating of CD45.1 cells from ethanol-PCLSA-immunized mice. G: CD45.1 transferred cells from ethanol-PCLSA-immunized mice were significantly increased (P < 0.001) compared with CD45.1 T cells from saline-injected or control-PCLSA-immunized mice. Values are means ± SE (n = 5 animals per group). H: livers were stained for CD3, CD45.1, and MAA and then overlaid to demonstrate colocalization. Sections were mounted in Fluoromount-G and viewed using a confocal laser-scanning microscope (Zeiss 710 Meta). Images were analyzed using Zen 2.1 Black software (Zeiss). Photomicrographs are representative of 5 separate immunohistochemical images.

