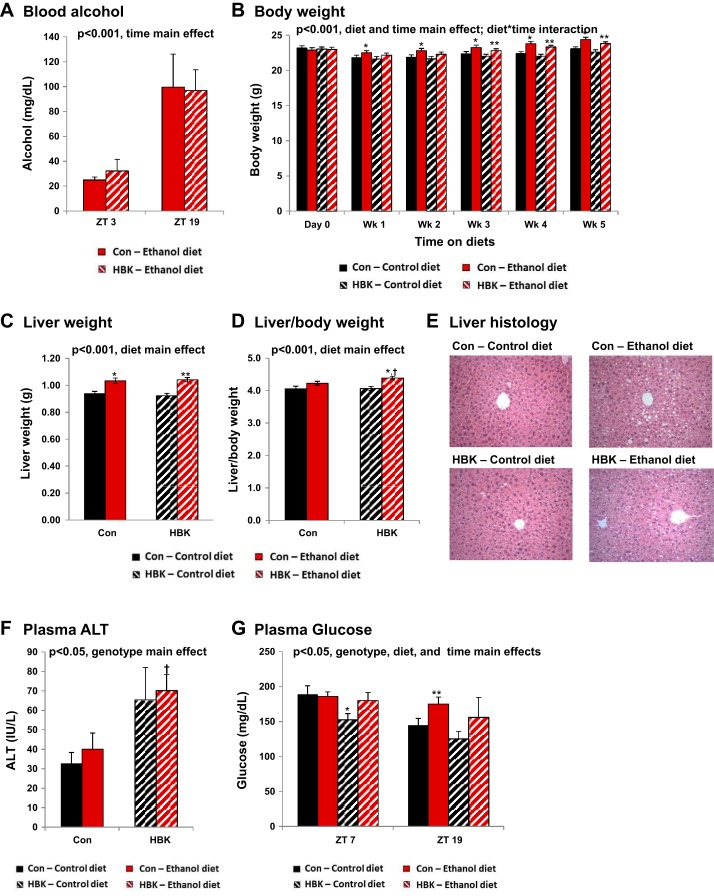
Fig. 2.
Effect of chronic alcohol consumption and hepatocyte-specific Bmal1 gene deletion on body, liver, and plasma measurements. Male hepatocyte-specific BMAL1 knockout (HBK) and control genotype (Con) littermates, 8 wk of age, were fed a control or alcohol-containing liquid diet for 5 wk. A: blood alcohol concentration (ZT 3 and ZT 19). B: initial and weekly body weight measurements. C: liver weight. D: liver-to-body weight ratio at the end of the feeding study. E: representative liver sections (ZT 11) stained with hematoxylin-eosin for steatosis (×200 magnification). Plasma ALT (ZT 11; F) and glucose levels (ZT 7 and 19; G) were determined at the end of the feeding study. Values are means ± SE. The sample size for body weight, liver weight, liver-to-body weight ratio, and ethanol consumption ranged from n = 30–39 mice/genotype/diet group. Note the large sample size due to the diurnal nature of this study. The sample size for blood alcohol, ALT, and glucose range from n = 3–8 mice/genotype/diet/time point. Solid black bars, Con mice fed control diet; solid red bars, Con mice fed the alcohol diet; striped black bars, HBK mice fed control diet; striped red bars, HBK mice fed the alcohol diet. Results for ANOVA analyses are provided in Table 3. *P < 0.05, compared with Con-control diet. **P < 0.05, compared with HBK-control diet. †P < 0.05, compared with Con-ethanol diet.

