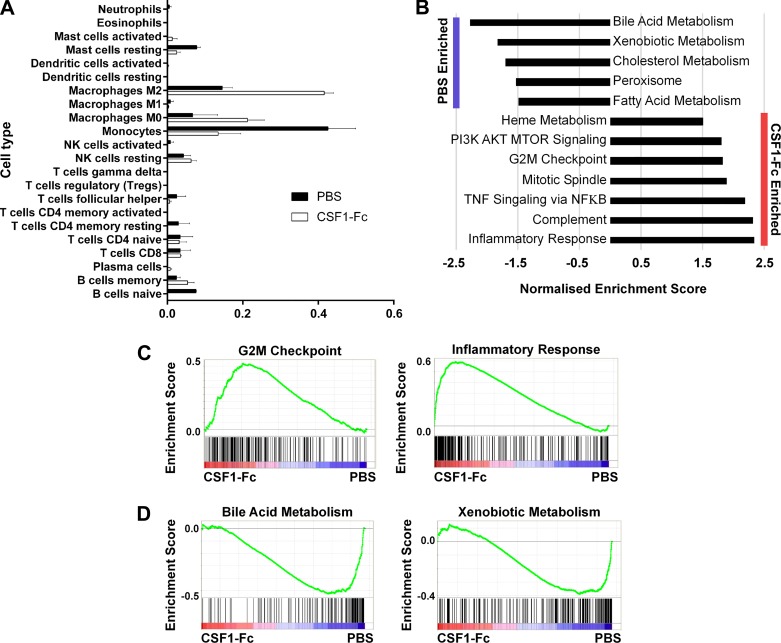
Fig. 6.
Gene set enrichment analysis of neonatal rat livers. Rats were injected with PBS on days 14–21 of pregnancy, and offspring were treated with PBS or 1 µg/g porcine CSF1-Fc on days 0–5. Livers were collected at day 6 for RNA isolation and subsequent microarray analysis. A: relative proportion of hematopoietic cell types in PBS- and CSF1-Fc-treated livers predicted using CIBERSORT. B: significantly enriched hallmark gene sets were determined by Gene Set Enrichment Analysis (FDR q-value <0.05). Example gene set enrichment plots for CSF1-Fc- (C) and PBS- (D) treated neonatal rat livers. Expression data were ranked according to normalized expression in CSF1-Fc vs. PBS-treated liver (indicated by red-blue bars), and the gene set of interest was mapped onto this profile (filled bars) to determine enrichment scores (green lines).

