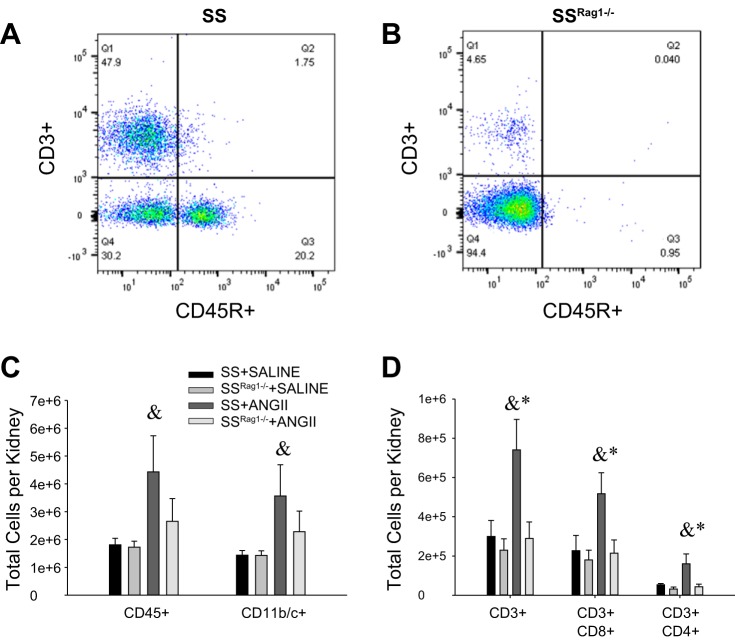
Fig. 4.
A and B: representative 2-dimensional plots of flow cytometric experiments identifying CD3+ T cells and CD45R+ B cells in SS and SSRag1−/− rats. C and D: total number of leukocytes (CD45+) and monocytes/macrophages (CD11b/c+) and total T lymphocytes (CD3+), CD8+ T lymphocytes, and CD4+ T lymphocytes in kidneys of SS and SSRag1−/− rats infused intravenously with 0.9% saline in a control period followed by intravenous infusion of ANG II (5 ng·kg−1·min−1) or 0.9% saline vehicle for 12 days. Values are means ± SE; n = 4–5/group. *P < 0.05 vs. SSRag1−/−, same treatment; &P < 0.05 vs. saline, same strain.

