Fig. 4.
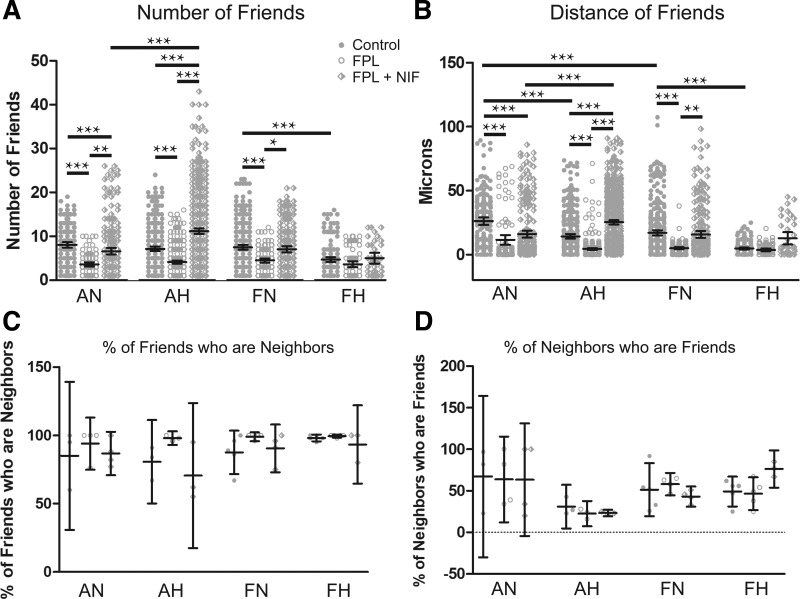
FPL 64176 (FPL) decreased the correlation among regions of interest (ROIs) with Ca2+ oscillatory events. A–D: arteries from each group were recorded en face and treated with DMSO (control, closed circles), 1 µM FPL (open circles), or 1 µM FPL with 10 µM nifedipine (NIF) (diamonds). They were analyzed for number of correlated ROIs, distance between correlated ROIs, percentage of nearby ROIs that were correlated, and percentage of correlated ROIs that were in nearby cells. Values are means ± 95% CI based on the number of ROIs (A and B) or number of animals (C and D). Data were analyzed by Kruskal-Wallis one-way ANOVA with Dunn's multiple comparison test. *P < 0.05, **P < 0.01, ***P < 0.001. Measurements of correlated ROIs and distance between these ROIs were obtained from the following. Control responses were obtained from 189/3 AN, 349/3 AH, 372/5 FN, and 175/5 FH ROIs and animals, respectively. FPL responses were obtained from 97/3 AN, 370/3 AH, 131/5 FN, and 81/5 FH ROIs and animals, respectively. NIF responses were obtained from 252/3 AN, 633/3 AH, 229/5 FN, and 37/5 FH ROIs and animals, respectively. Percentage of neighboring correlated ROIs were obtained from the following. Control responses were obtained from 3/3 AN, 3/3 AH, 5/5 FN, and 5/5 FH experimental recordings and animals, respectively. FPL responses were obtained from 4/3 AN, 3/3 AH, 5/5 FN, and 5/5 FH experimental recordings and animals, respectively. FPL with NIF responses were obtained from 4/3 AN, 3/3 AH, 5/5 FN, and 5/5 FH experimental recordings and animals, respectively.

