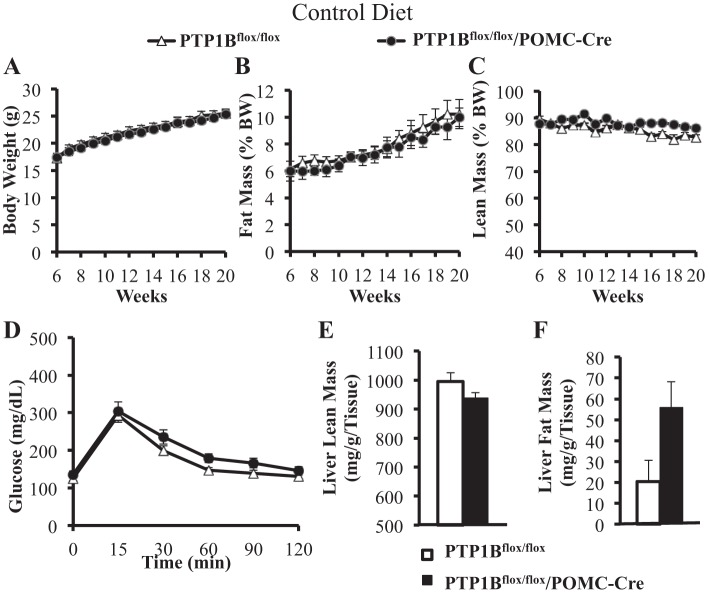
Fig. 2.
Body composition, glucose tolerance, and liver lipid analysis of mice fed a normal control diet. Body weights were measured twice weekly in PTP1Bflox/flox (n = 15) and PTP1Bflox/flox/POMC-Cre (n = 9) mice. EchoMRI for lean and fat mass were conducted once per week for the duration of the study. A: body weight (g) from 6 to 20 wk of age. B: fat mass [%body weight (%BW)] from 6 to 20 wk of age. C: lean mass (%BW) from 6 to 20 wk of age. D: after a 5-h fast, glucose tolerance was measured in PTP1Bflox/flox (n = 15) and PTP1Bflox/flox/POMC-Cre (n = 6) over 120 min postglucose gavage. E and F: whole liver lean mass (mg/g liver tissue wt) and lipid accumulation (mg/g liver tissue wt) analysis in PTP1Bflox/flox (n = 5) and PTP1Bflox/flox/POMC-Cre (n = 3) mice assessed with EchoMRI. Data are expressed as means ± SE. There were no statistically significant changes as assessed by 2-way ANOVA with post hoc Sidak’s multiple comparison, t-test following linear regression analysis (A–D), or unpaired Student’s t-test (E and F).

