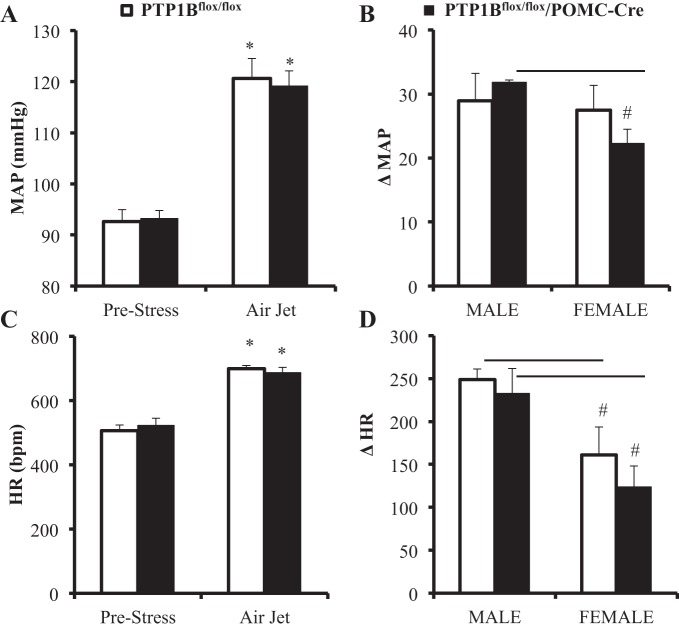
Fig. 9.
Mean arterial pressure (MAP) and heart rate (HR) responses to acute air jet stress in PTP1Bflox/flox (n = 8) and PTP1Bflox/flox/POMC-Cre (n = 8) mice fed a HFD. A: MAP (mmHg) at baseline and during acute stress. B: change in MAP from baseline in PTP1Bflox/flox (males, n = 3; females, n = 5) and PTP1Bflox/flox/POMC-Cre (males, n = 3; females, n = 5) during air jet stress. C: HR (beats/min) at baseline and during acute stress. D: change in HR from baseline in PTP1Bflox/flox (males, n = 3; females, n = 5) and PTP1Bflox/flox/POMC-Cre (males, n = 3; females, n = 5) during air jet stress. Data are expressed as means ± SE. *P < 0.05, paired Student’s t-test comparing MAP and HR values during air jet stress with prestress values; #P < 0.05, unpaired Student’s t-test comparing male vs. female changes in MAP and HR during air jet stress in PTP1Bflox/flox or PTP1Bflox/flox/POMC-Cre mice.

