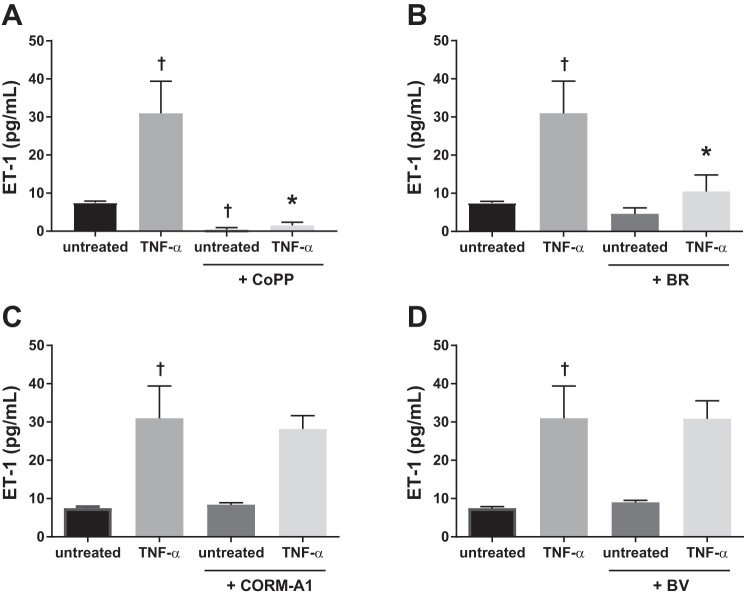
Fig. 3.
TNF-α-induced ET-1 production in HGEnCs. Data are shown for the effect of 25 µM CoPP (A), 10 µM bilirubin (BR) (B), 100 µM CORM-A1 (C), and 10 µM biliverdin (BV) treatment (D) on TNF-α (10 ng)-induced ET-1 production in HGEnCs (n = 12/group). All data are means + SD. Statistical analysis was performed using one-way ANOVA followed by Tukey’s post hoc test. †P < 0.001 vs. untreated group: *P < 0.001 vs. TNF-α group.

