Fig. 2.
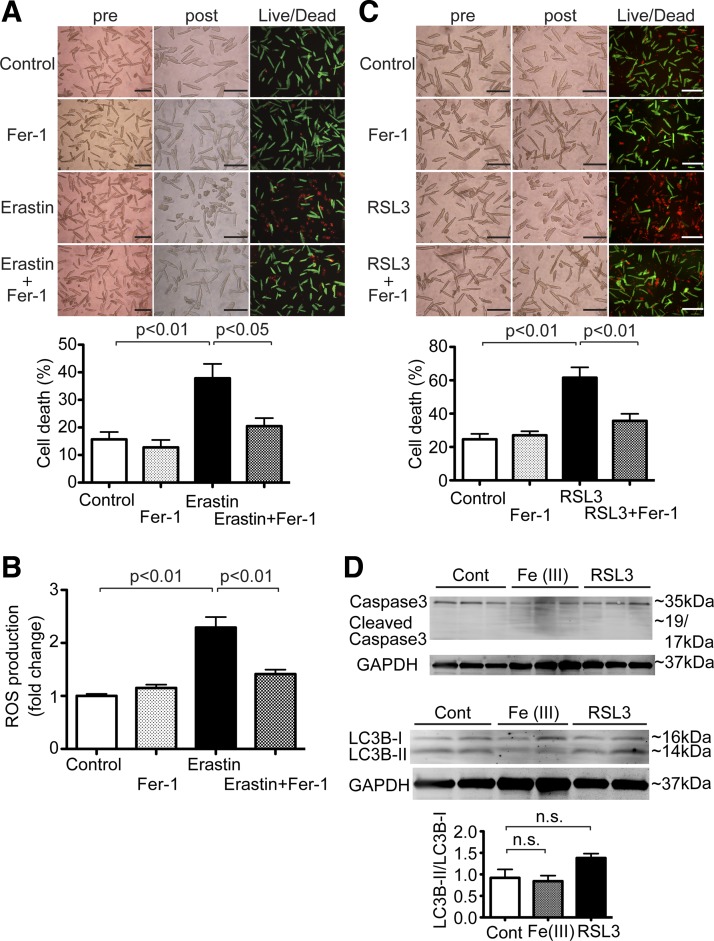
Ferroptosis in cardiomyocytes (CMs). A: erastin-induced CM cell death. Top, representative images of CM cell death induced by erastin. Adult mouse CMs isolated from wild-type (WT) mice were treated with 50 μM erastin or vehicle control in the presence or absence of 10 μM ferrostatin-1 (Fer-1) for 16 h. Morphological changes in CM cell culture were assessed before applying the agents (pre) and at the end of experiments (post). Cell death was assessed by a Live/Dead assay. Representative images are shown from 4 independent experiments. Scale bars = 200 µm. Bottom, quantitative data of CM cell death. Percent cell death was calculated as described in Fig. 1; n = 4. B: reactive oxygen species (ROS) production after erastin treatment in WT CMs. ROS production was assessed in WT CMs treated with 50 μM erastin or vehicle control in the presence or absence of 10 μM Fer-1 for 16 h. ROS production was measured by 2′,7′-dichlorodihydrofluorescein diacetate; n = 5. C: Ras-selective lethal 3 (RSL3)-induced CM cell death. Top, representative images of CM cell death induced by RSL3. Adult mouse CMs isolated from WT mice were treated with 1 μg/ml RSL3 or vehicle control in the presence or absence of 10 μM Fer-1 for 16 h. Representative images are shown from 6 independent experiments. Scale bars = 200 µm. Bottom, quantitative data of CM cell death. Percent cell death was calculated as described in Fig. 1; n = 6. D: expression levels of cleaved caspase-3 and light chain (LC)3B in WT CMs treated with vehicle control (Cont), 1 mM Fe(III)-citrate, or 1 μg/ml RSL3 for 16 h. Top, representative immunoblots of cleaved caspase-3 and LC3B in CMs. Bottom, densitometric quantitation of LC3B expression. Data are ratios of LC3B-II to LC3B-I. Control, n = 3; Fe(III), n = 3; RSL3, n = 3.

