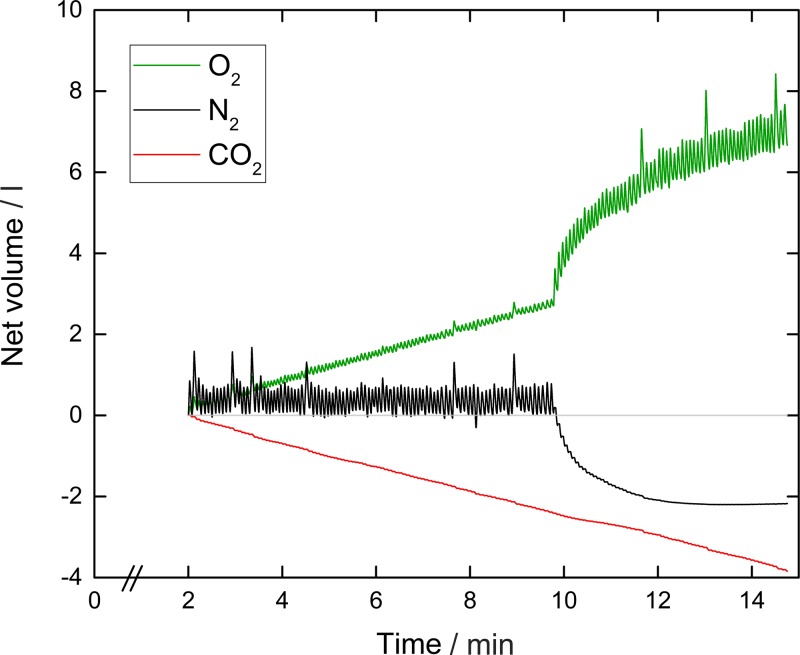
Fig. 2.
Example record of a lung inhomogeneity test conducted using in-airway molecular flow sensing. Shown are the tidal flows for oxygen, carbon dioxide, and nitrogen. The upward trend for oxygen indicates oxygen consumption, and the downward trend for carbon dioxide indicates carbon dioxide production. The absence of any trend in the nitrogen record reflects the lack of any net uptake or production of nitrogen apart from the washout period which begins at ∼10 min, when the inspirate is changed from air to 100% oxygen. Although not visible, data are recorded every 10 ms.

