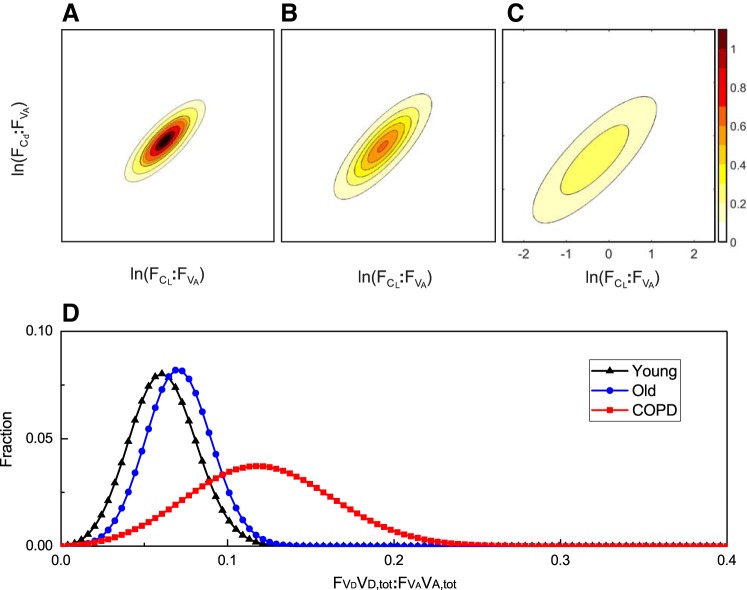
Fig. 7.
Distributions associated with the mean lung parameters from the 3 groups of participants. A–C: contour plots for the bivariate log normal distributions for the young group (A), the old group (B), and the COPD group (C). Contour intervals are values for the probability density function. D: normal distributions for the dead space relative to alveolar volume at FRC for all 3 groups. These distributions have been illustrated in a discretized form, with 100 points evenly spaced on a scale from 0 to 0.4.

