
Fig. 2.
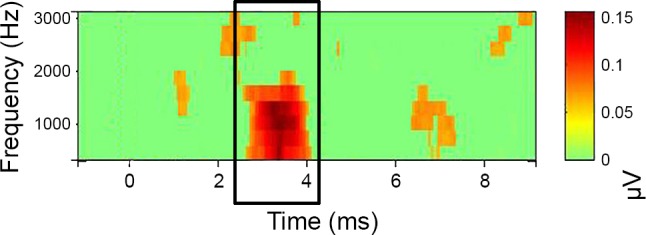
PLV time-frequency plot. Time-frequency analysis was used to estimate PLV of N1 (EEGlab) within linearly spaced frequencies from 625 to 3,120 Hz. x-Axis represents time (signal onset = 1 ms). y-Axis represents frequency. The strength of the PLV above baseline (green) is indicated by color (red). Window size was 1.6 ms, with a padratio of 2. PLVs were extracted from a 2-ms window surrounding the peak of N1.