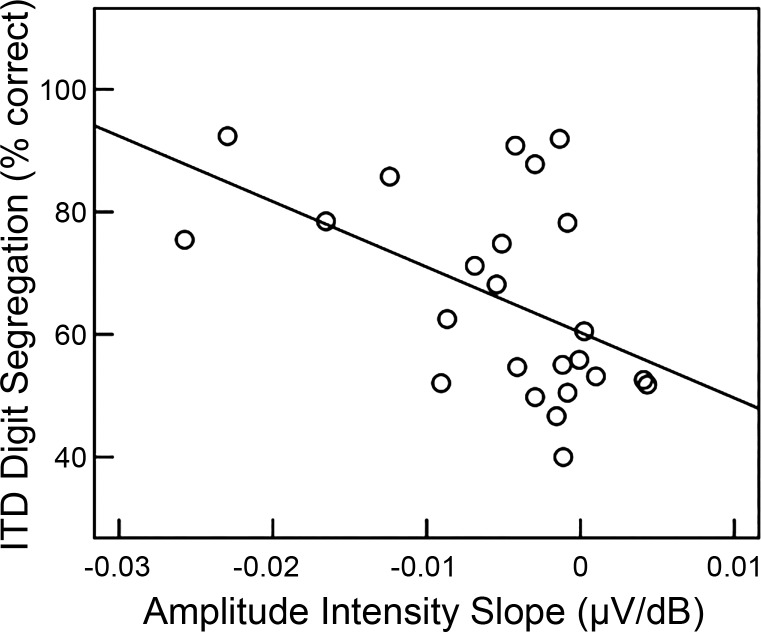
Fig. 8.
Scatterplot showing individual differences in average performance (% correct across ITD) on the ITD digit segregation task plotted against the slope of the CAP amplitude-intensity function. Twenty-four of 26 participants completed the ITD digit segregation task. Those participants with steeper slopes of N1 amplitude-intensity functions had better ITD digit segregation task performance.

