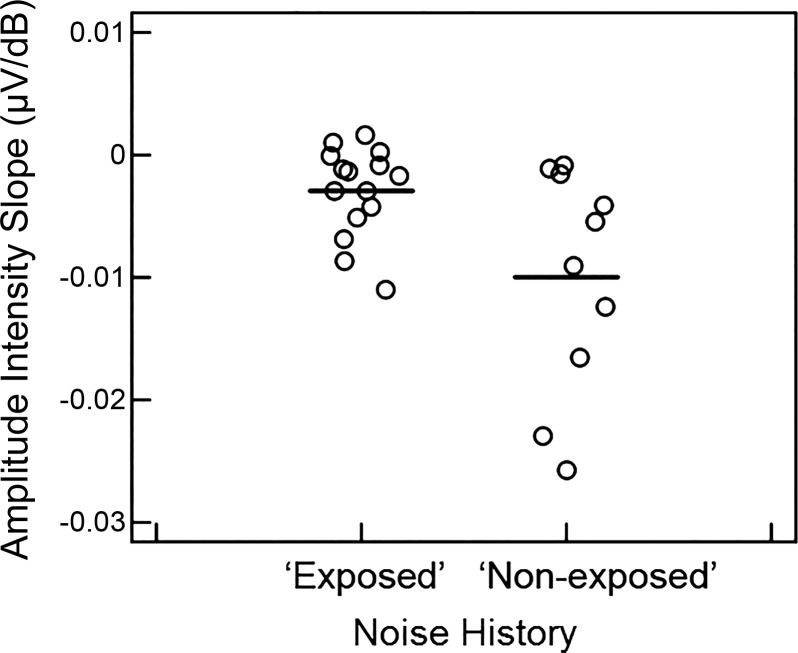
Fig. 9.
Slopes of CAP amplitude-intensity functions for participants in exposed and nonexposed noise history groups. Participants in the exposed group exhibited significantly shallower slopes of N1 amplitude-intensity functions than the nonexposed group (P < 0.05). Horizontal lines indicate the mean slope of each group.

