Fig. 7.

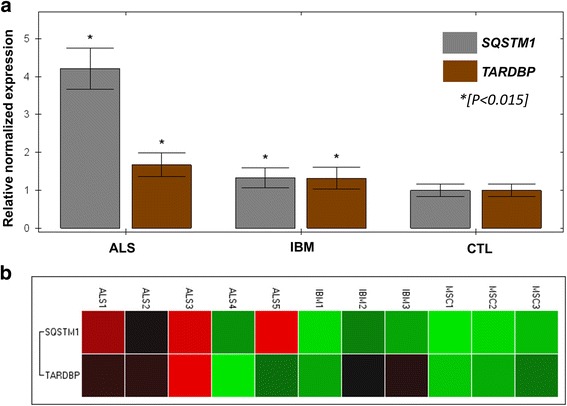
qPCR analysis was performed in 5 ALS muscle samples (“ALS1–5”) and 3 IBM muscle samples (“IBM1–3”), all containing p62 and pTDP-43 inclusions by immunohistochemical studies (see Results). Three non-ALS, non-IBM samples with mild neurogenic atrophy in the muscle biopsy were also studied (“MSC1–3”). SQSTM1 and TARDBP were analyzed relative to the expression of two housekeeping genes (18 s, GAPDH) and data shown are combined from two 96-well plates (4 replicates per sample and primer). There was a significant increase in relative normalized gene expression for both ALS and IBM samples (a), relative to controls (right) and this was most significant for SQSTM1 expression in ALS samples (> 4-fold expression relative to controls, P < 0.0001). Clustergram by gene target (b) shows heterogeneity across ALS and IBM samples with increase gene expression (red-brown) most conspicuous in ALS samples 1–3 and 5, as well as IBM samples 2 and 3
