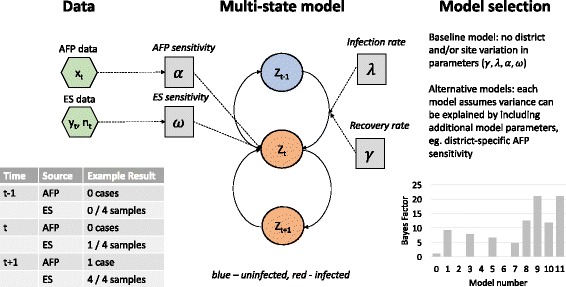
Fig. 2.

Schematic of the model framework. Inputs into the model (green hexagons) are AFP and ES data from each district each month. The model assumes that a district is either infected or uninfected at each time-point (states are indicated by circles), and transitions (solid arrows) between states are determined by the data and model parameters (grey boxes). Candidate models are compared to the baseline model by estimating the Bayes Factor of each
