
Fig. 4.
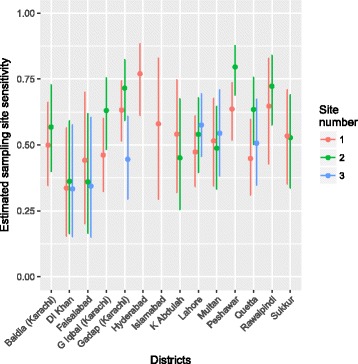
Estimates of environmental site sensitivity for detection of serotype 1 WPV for each district included in the analysis. The number of sites per district varies from 1 to 3. 95% CI are indicated by the vertical lines
Official websites use .gov
A
.gov website belongs to an official
government organization in the United States.
Secure .gov websites use HTTPS
A lock (
) or https:// means you've safely
connected to the .gov website. Share sensitive
information only on official, secure websites.
Estimates of environmental site sensitivity for detection of serotype 1 WPV for each district included in the analysis. The number of sites per district varies from 1 to 3. 95% CI are indicated by the vertical lines