Fig. 5.

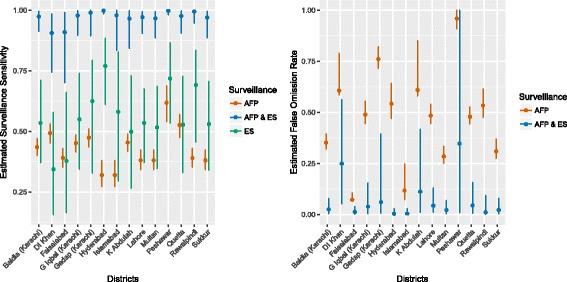
Estimates of the sensitivity of surveillance by each surveillance source (a), and the false omission rate (b) estimated from the best-fitting multistate model. Vertical lines indicate the 95% credible intervals of the estimate

Estimates of the sensitivity of surveillance by each surveillance source (a), and the false omission rate (b) estimated from the best-fitting multistate model. Vertical lines indicate the 95% credible intervals of the estimate