Fig. 3.

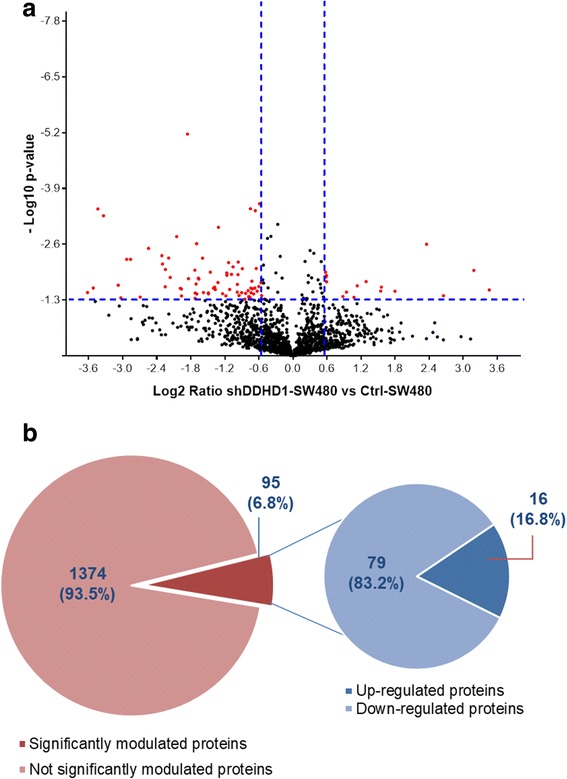
Quantitative proteomic analysis between Ctrl-SW480 and shDDHD1-SW480 cells. a Volcano plot of 1469 quantified proteins illustrating expression increases and decreases following DDHD1 silencing. Red dots correspond to proteins showing a fold change (FC) ≥ ±1.5 in relative abundance and a p-value < 0.05 (values indicated by vertical and horizontal dashed lines) and considered significantly differentially modulated in Ctrl-SW480 and shDDHD1-SW480 cells. b Diagram on the left illustrates the number of proteins quantified by SWATH-MS that resulted unchanged or significantly changed (Fold Change ≥ ±1.5; p < 0.05). Diagram on the right indicates the number of proteins up- and down-modulated by DDHD1-silencing. Numbers in parentheses indicate the percentage of total proteins
