Fig. 4.

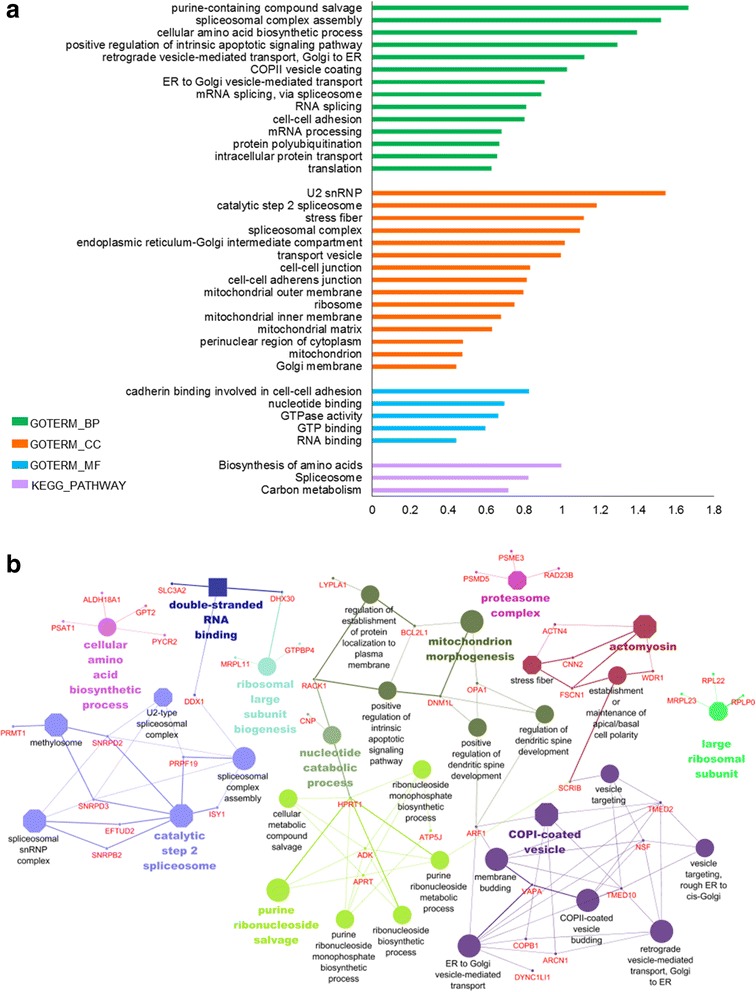
GO and KEGG pathway enrichment of shDDHD1-DownRegProteins according to DAVID functional annotation and ClueGO/CluePedia plugin. a The histogram shows for each GO term, Cellular Component (CC), Biological Process (BP) and Molecular Function (MF) (Fold enrichment ≥2.5, p ≤ 0.05) of shDDHD1-down-regulated proteins quantified using the SWATH-MS approach. b Network view of shDDHD1-down-regulated proteins. Terms (each represented as node) are functionally grouped based on shared proteins (kappa score ≥ 0.4) and are shown with different colors. The specific players (proteins) of each node are highlighted with the respective gene name. Node color represents the class they belong to. The size of the nodes indicates the degree of significance. Within each class, the most significant term (indicated with colored and bold characters) defines the name of the group. Octagon: CC; Ellipses: BP; Square: MF
