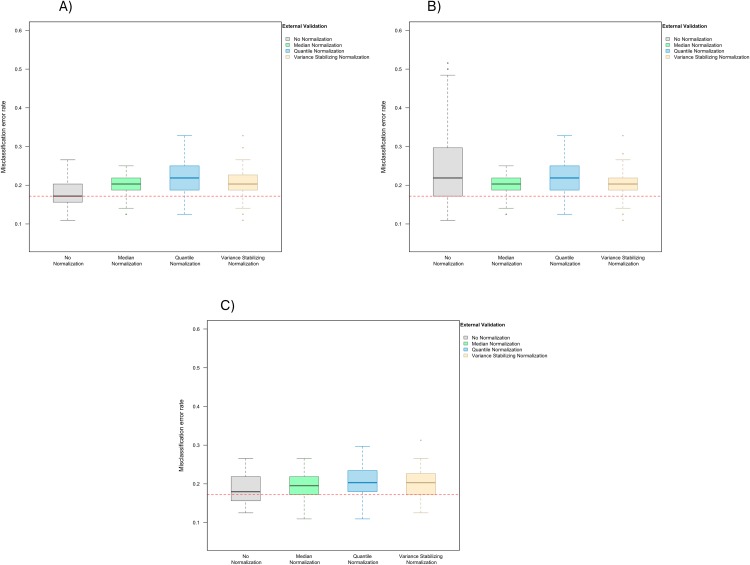
Figure 4. Boxplot of the misclassification error rates based on external validation when using the LASSO method for building a classifier.
The simulated training data possessed confounding handling effects. x-axis indicates the normalization method for the training data; y-axis indicates the misclassification error rate as a percentage. (A–C) display the misclassification error when handling effects in the simulated training data were not amplified (A), amplified by location shift (B), and amplified by scale change (C). In (A–C) the horizontal red line indicates the level of classification error rate in the ideal case when the training data possessed no confounding handling effects and received no normalization.

