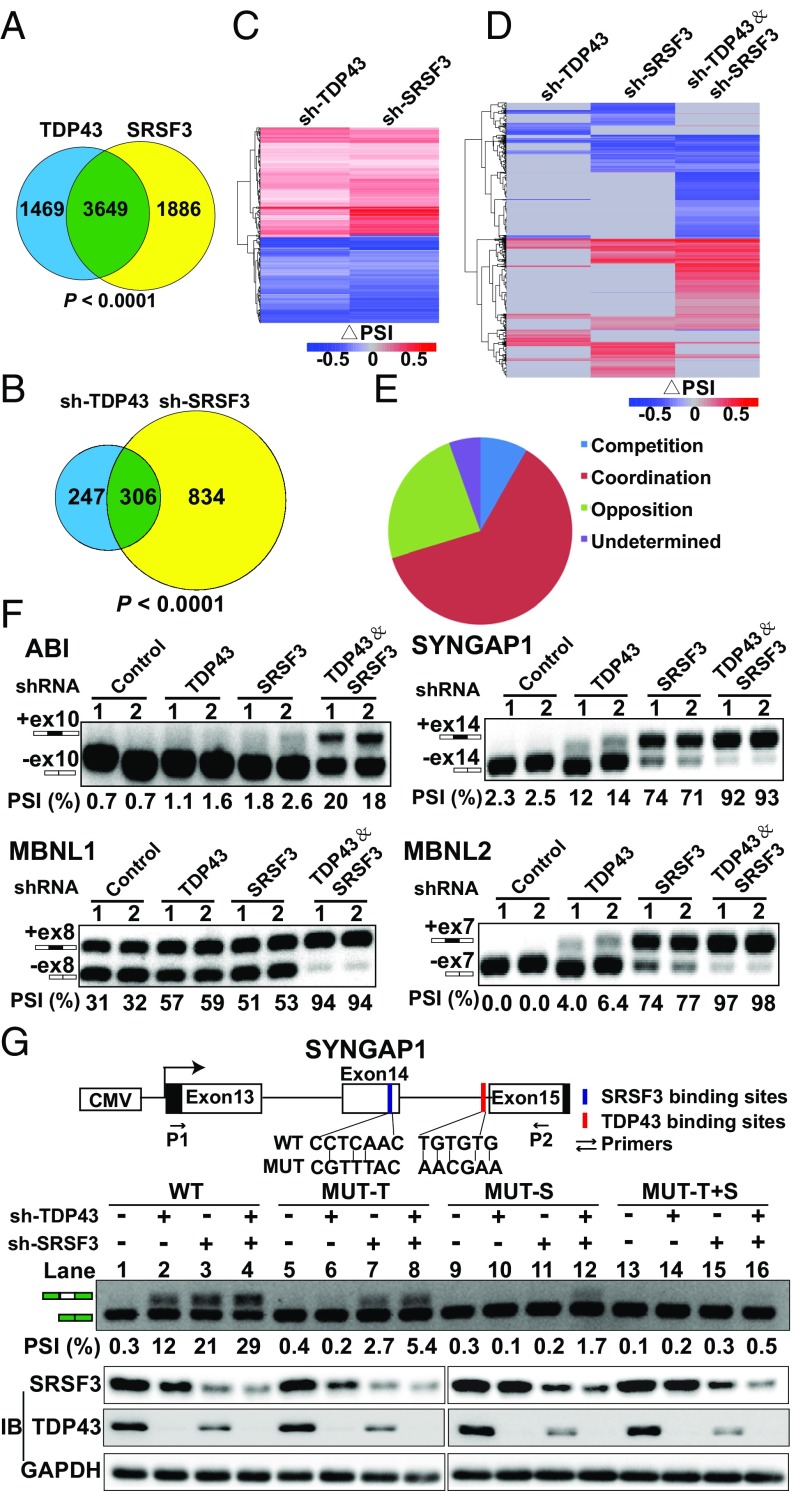
Fig. 6.
TDP43 coordinately regulates alternative splicing with SRSF3. (A) Venn diagram showing overlapping mRNAs between TDP43 RIP-seq and SRSF3 RIP-seq binding results. (B) Venn diagram showing coregulated splicing events using RNA-seq data after knockdown of SRSF3 and TDP43 in MDA-MB231 cells. (C) Heatmap of common regulated splicing events after knockdown of SRSF3 and TDP43 in MDA-MB231 cells. (D) Heatmap of all splicing events after knockdown of SRSF3, TDP43, and both in MDA-MB231 cells. (E) Percentage distribution of coordination, competition, opposition, and others based on the heatmap in D. (F) Random examples of coordination splicing events verified by semiquantitative PCR. Two shRNAs (1 and 2) were used for each group. Representative data are from three independent experiments. (G, Top) Minigene assay for verifying coordination between TDP43 and SRSF3. Graphical representation of the control splicing reporter (WT), the MUT-T motif (specifically introducing mutations to TDP43-binding sites) (red), the MUT-S motif (specifically introducing mutations to SRSF3-binding sites) (blue), and the PGZ+T&S motif (introducing mutations to both binding sites). P1 and P2 indicate PCR primers for splicing analysis. (Middle) Semiquantitative RT-PCR analyses were performed for the above four minigenes after TDP43 or SRSF3 knockdown. (Bottom) Western blotting was performed to verify the knockdown of TDP43 and SRSF3.

