Fig. 7.
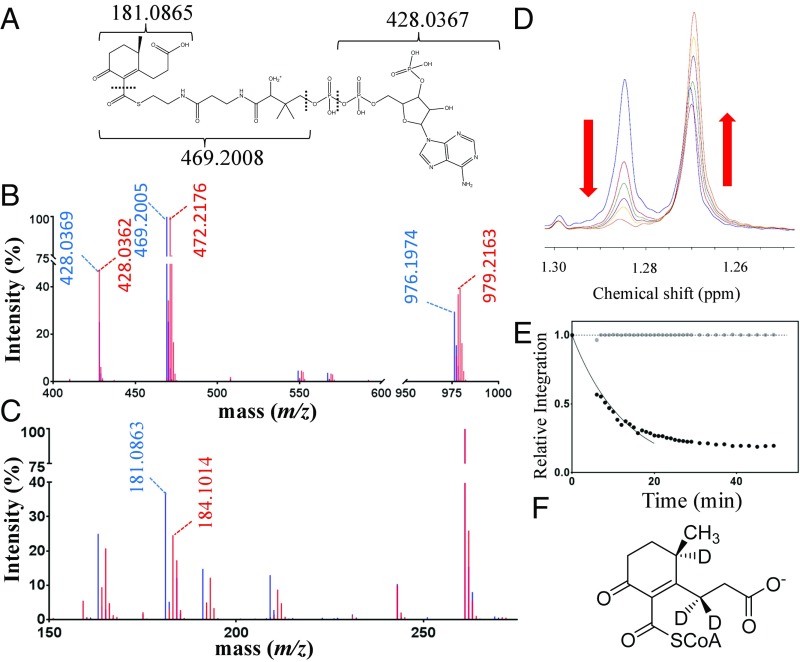
IpdAB catalyzes proton exchange on COCHEA-CoA. (A) Diagram depicting predicted fragments from MS3 on COCHEA-CoA. (B) LC-MS/MS mass spectra of COCHEA-CoA following incubation in D2O with (red) and without (blue) IpdABRHA1. (C) LC-MS3 mass spectra of COCHEA-CoA following incubation with (red) and without (blue) IpdABRHA1. (D) The 1H-NMR spectra displaying the time-dependent decrease in the C-10 methyl doublet of COCHEA-CoA upon incubation of IpdABRHA1 in D2O. The blue trace represents the spectrum before the addition of IpdABRHA1. The red, green, purple, yellow, and orange traces represent the spectra at 6, 11, 16, 21, and 52 min, respectively, after enzyme addition. (E) Time course displaying the relative decrease in proton integration for the C-9 methyl doublet (1.28 ppm; black dots) and the C-36 methyl group (0.75 ppm; gray dots) in the CoA moiety of COCHEA-CoA following addition of IpdABRHA1. Solid curve displays the best fit of Eq. 2 to the initial 20 min of data. Dotted line indicates relative intensity = 1.0. (F) Location of deuteration (D) on COCHEA-CoA as determined by NMR.

