Fig. 7.
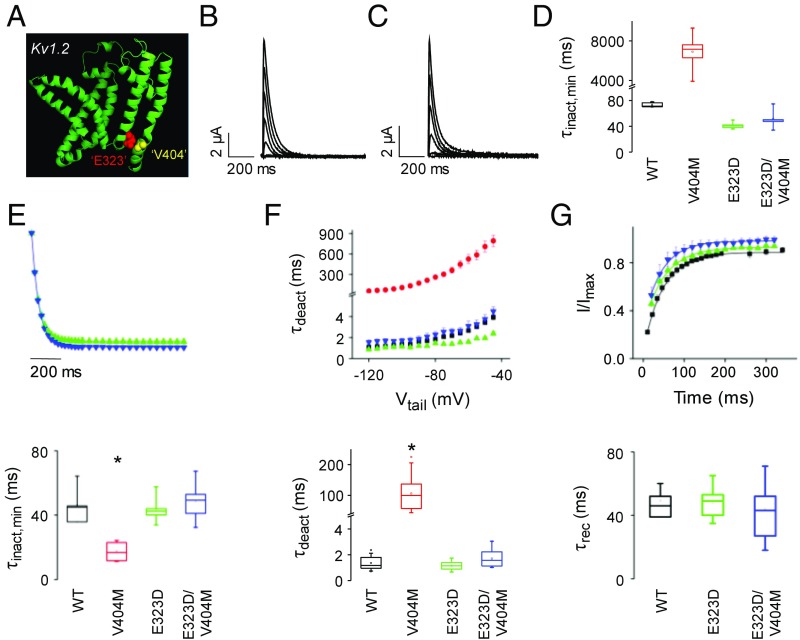
Volume-compensating second site mutation, E323D, reverses effects of V404M on the kinetics of CSI, deactivation, and recovery from inactivation. (A) Ribbon diagram shows the peptide backbone of the membrane domain (S1–S6) of Kv1.2 subunit (Protein Data Bank ID code 2A79) (18) with space-filling representations of residues homologous to E323 (red) and V404M (yellow). These residues correspond to E395 and V476 in Shaker. The figure was made using Pymol. (B) E323D currents were evoked by stepping from −100 mV to voltages from −60 to +60 mV in 10-mV increments. Representative traces, obtained at 20-mV increments, are shown. (C) E323D+V404M currents were evoked by stepping from −100 mV to voltages from −40 to +80 mV in 10-mV increments. Representative traces, obtained at 20-mV increments, are shown. (D) Box plot shows minimum values of τinact obtained by fitting the decay of macroscopic currents with a single exponential function. Mean values of τinact,min ± SEM were the wild type (n = 6), 69 ± 2 ms at −40 mV; V404M (n = 6), 6,912 ± 722 ms at −60 mV; E323D (n = 7), 41 ± 2 ms at 0 mV; and E323D+V404M (n = 8), 52 ± 4 ms at +20 mV. Because it was infeasible to compare values of τinact,min for all of the constructs at the same voltage, statistical analysis is not reported. (E, Upper) Kinetics of inactivation from the closed state at +10 mV for E323D (green ▲; n = 6) and at +20 mV for E323D+V404M (blue ▼; n = 8) were characterized using the closed-state protocol shown in Fig. 3A, Upper Left. Data are provided as mean ± SEM. (E, Lower) Box plot shows minimum values of τinact (τinact,min) for the wild type, V404M, E323D, and E323D+V404M. Values of τinact,min were obtained by fitting single exponential functions to plots of τinact vs. voltage (Fig. S4). Mean values of τinact,min ± SEM were the wild type (n = 8), 46 ± 3 ms; V404M (n = 7), 18 ± 2 ms; E323D (n = 5), 44 ± 4 ms; and E323D+V404M (n = 8), 49 ± 4 ms. Value of τinact,min for V404M differed significantly from the wild type, E323D, and E323D+V404. *P < 0.00001. (F, Upper) Values of τdeact, obtained as described in Fig. 4, have been plotted vs. tail voltage for the wild type (■), V404M (red ●), E323D (green ▲), and E323D+V404M (blue ▼). Values of τdeact in E323D differed significantly from wild-type Kv4.2 (P < 0.01 to P < 0.0001) and E323D+V404M (P < 0.001 to P < 0.0001) between −90 and −45 mV. (F, Lower) Box plot shows values of τdeact at −100 mV. Mean values of τdeact ± SEM were the wild type (n = 24), 1.4 ± 0.1 ms; V404M (n = 29), 105.9 ± 9.3 ms; E323D (n = 15), 1.2 ± 0.1 ms; and E323D+V404M (n = 10), 1.6 ± 0.3 ms. Value of τdeact for V404M differed significantly from the wild type, E323D, and E323D+V404. *P < 0.00001. (G, Upper) The wild type (■), E323D (green ▲), and E323D+V404M (blue ▼) were maximally inactivated by pulsing from −100 to +60 mV (the wild type and E323D) or +80 mV (E323D+V404M) for 500 ms. Recovery from inactivation was monitored by repolarizing to −100 mV for various durations before a test pulse to +60 mV (the wild type and E323D) or +80 mV (E323D+V404M). Remaining peak current amplitude during the test pulse was measured, normalized to the peak current amplitude during the first pulse, and plotted vs. recovery time. (G, Lower) Box plot shows τrec at −100 mV for the wild type, E323D, and E323D+V404M. Mean values of τrec ± SEM were the wild type (n = 4), 49 ± 4 ms; E323D (n = 13), 48 ± 2 ms; and E323D+V404M (n = 7), 47 ± 6 ms. These values did not differ significantly. WT, wild type.

