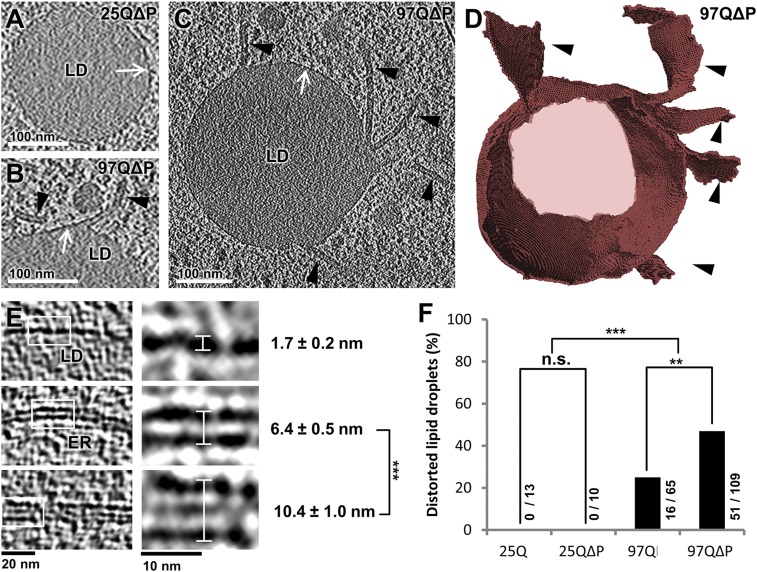
Fig. 5.
Expanded polyQ-induced distortions in LDs. (A–C) Tomographic slices of LDs from cells expressing 25QΔP (A) or 97QΔP (B and C). White arrows point to the LD phospholipid monolayer, and black arrowheads mark planar protrusions. (D) 3D rendering of C. (E) Tomographic slices at lower (Left) and higher (Right) magnification of a LD phospholipid monolayer (Top), a phospholipid bilayer (ER membrane; Middle), and a LD planar protrusion (Bottom). The measured thickness of each of these structures is shown (white lines). Tomographic slices are 2.1 nm (A) or 1.4 nm (B–E) thick. ***P < 0.001 by t test. (F) Quantification of the percentage of distorted LDs. The numbers beside or above the bars indicate the number of distorted LDs and the total number of LDs observed in the tomograms taken for each condition. Note that the frequency of LD distortions correlates with the toxicity of the HttEx1 constructs. **P < 0.01, ***P < 0.001 by χ2 test; n.s., not significant.

