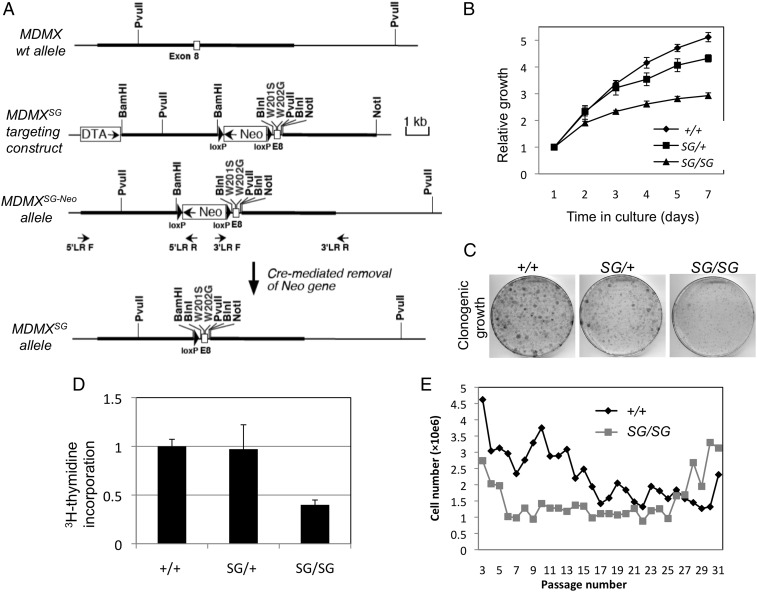
Fig. 2.
Generation of MDMXSG mutant mice and embryo fibroblasts. (A) Diagram of the knockin targeting construct for introducing the W201S/W202G substitutions into mouse MDMX. (B) Growth curve of primary MEFs. MEFs of the indicated genotypes (from littermates) were cultured under identical conditions, and cell numbers were determined at the indicated intervals. Three cell lines were tested for each genotype. (C) MEFs were plated at low density (500 cells per 10-cm plate) and cultured for 14 d. Colonies were stained with crystal violet. The result is representative of three cell lines for each genotype. (D) The rates of cell proliferation in the indicated MEFs (n = 3) were determined by pulse labeling with [3H]thymidine and measuring the incorporation into DNA. (E) Primary MEFs from wild-type and MDMXSG/SG littermate embryos were cultured following the 3T3 protocol. The cell density at each passage is plotted. The result is representative of three cell lines for each genotype. Error bars indicate standard deviation.

