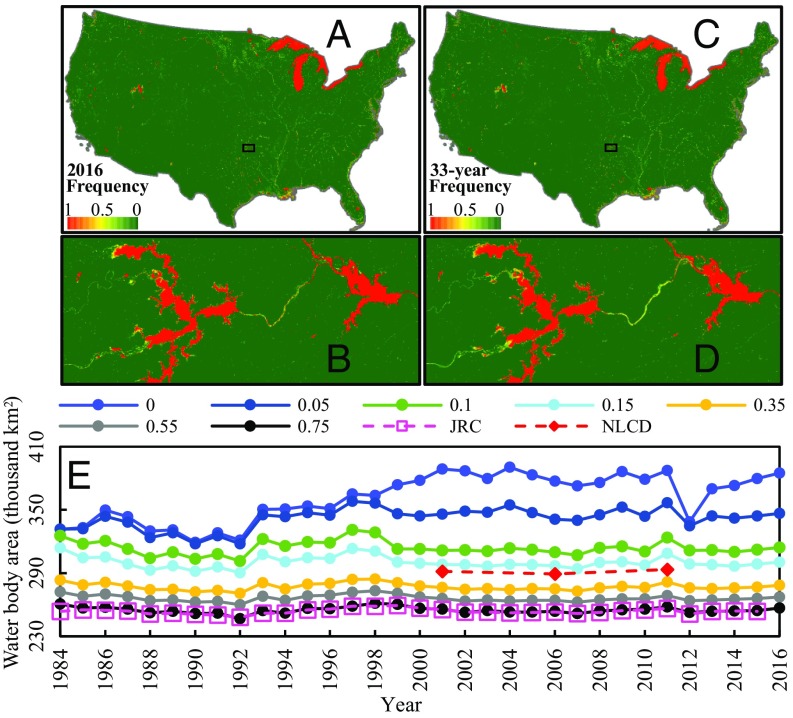
Fig. 1.
Water body frequency maps and water body areas using different frequency thresholds in the CONUS. (A) Annual water body frequency map in 2016 and (B) its zoom-in view of eastern Oklahoma. (C) A 33-y water body frequency map during 1984–2016 and (D) its zoom-in view of eastern Oklahoma. (E) Total water body area of all pixels within CONUS with water body frequencies >0, ≥0.05, ≥0.1, ≥0.15, ≥0.35, ≥0.55, and ≥0.75, respectively, in our datasets; the permanent water body areas from the JRC dataset during 1984–2015; and the water body area from NLCD in 2001, 2006, and 2011. Water body frequency is the ratio of water body observations to total good observations in a year (A) or all 33 y during 1984–2016 (C).

