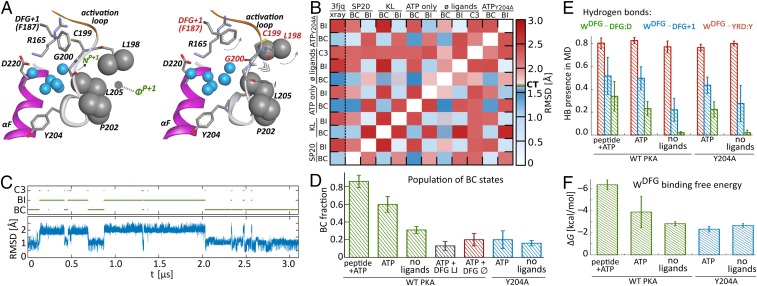
Fig. 2.
P + 1 loop states and DFG water binding. (A) Centroids of clusters representing P + 1 loop conformations in BC and BI states. (B) Rmsd matrix illustrating the similarity of BC and BI clusters in all systems (CT, 1.7 Å cutoff threshold used for clustering). (C) Time evolution of P + 1 loop rmsd with respect to the 3FJQ structure, illustrating bimodal switching between clusters during a representative MD trajectory. (D) Population of BC states in all considered cases. (E) Fraction of hydrogen bonds to DFG water. (F) Binding free energy of DFG water to PKA.

