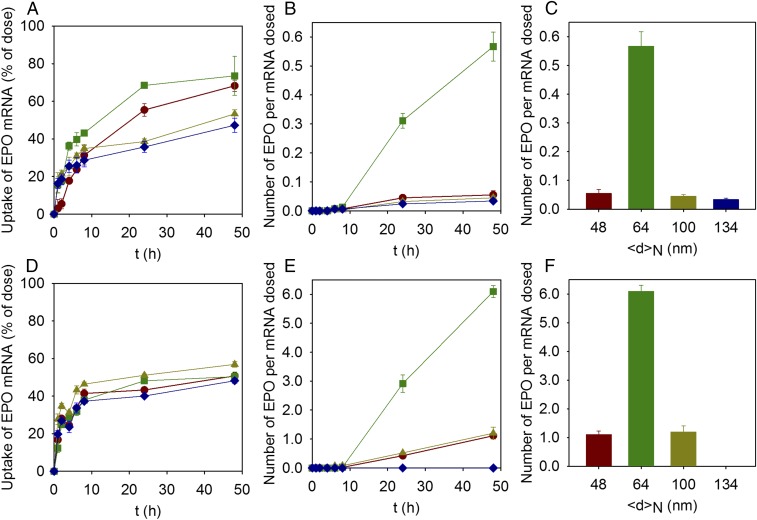
Fig. 1.
Cellular uptake and cellular protein production for LNPs of different sizes prepared with the standard variation of size approach. (A and D) Uptake of LNPs expressed as the percent of hEPO mRNA dosed as a function of time in (A) adipocytes and (D) hepatocytes for LNPs with lipid molar compositions of DLin-MC3-DMA:DSPC:Chol:DMPE-PEG2000 in the ratio 50:10:40-X:X for X: 3% (<d>N = 48 nm; red circles), 1.5% (<d>N = 64 nm; green squares), 0.5% (<d>N = 100 nm; yellow triangles), and 0.25% (<d>N = 134 nm; blue diamonds). Lines are to guide the eye. (B and E) Number of hEPO produced per mRNA dosed as a function of time in (B) adipocytes and (E) hepatocytes for LNPs with the same lipid composition as A and D. Lines are to guide the eye. (C and F) Number of hEPO produced per mRNA dosed after 48 h of dosing (C) adipocytes and (F) hepatocytes for LNPs with the same lipid composition as A and D. The experiments were done in the presence of 1% human serum. Values are means ± SEM (n = 3).

