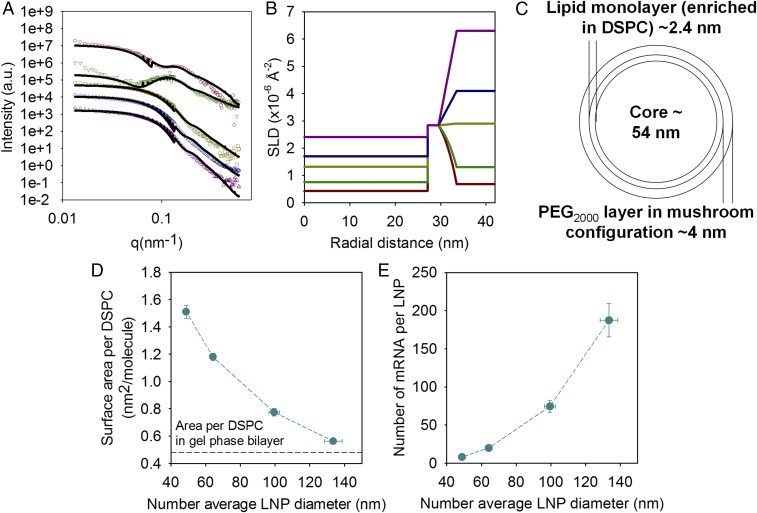
Fig. 4.
Characterization of the lipid distribution within the LNPs, their surface composition, and number of mRNA per LNPs. (A) SANS data (symbols) for mRNA containing LNPs with a lipid molar compositions of DLin-MC3-DMA:DSPC:Chol:DMPE-PEG2000 in the ratio 50:10:38.5:1.5 with deuterated DSPC and Chol in 18% (red circles), 27% (green inverted triangles), 50% (yellow squares), 68% (blue diamonds), and 100% (purple triangles) D2O buffer. The solid lines correspond to the best fit using the multishell model with exponential decay. Only the data at low q are plotted, and the intensity of the samples in the upper curves has been offset for clarity. (B) Scattering length density (SLD) profiles as a function of the distance to the center of the LNPs corresponding to the fits of the data in A. (C) Schematic representation of the lipid distribution in the LNP according to the SLD radial profile. (D) Area per DSPC molecule and (E) number of mRNA per LNP as a function of the LNP size for LNPs with lipid molar compositions of DLin-MC3-DMA:DSPC:Chol:DMPE-PEG2000 in the ratio 50:10:40-X:X. The horizontal line in D corresponds to the reported value of the area per DSPC in the gel phase (26). Lines are to guide the eye. Values are means ± SEM (n = 3).

