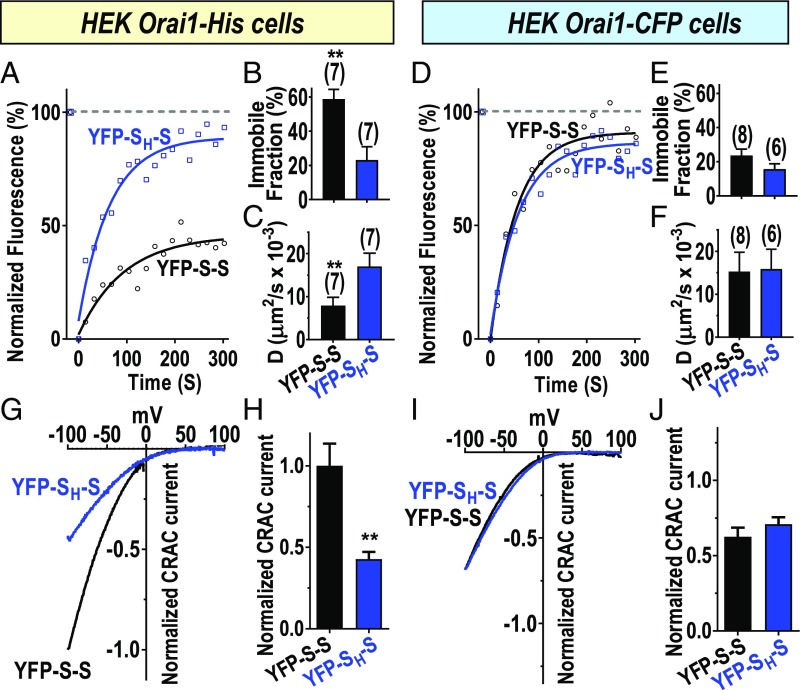
Fig. 2.
Changes in channel mobility and function resulting from SOAR dimer-induced cross-linking of Orai1 channels. (A–F) Measurement of fluorescence recovery after photobleaching (FRAP) to assess diffusional characteristics. (A–C) Using stable HEK Orai1–His cells, YFP-S-S or YFP-SH-S were expressed and fluorescence compared with prebleached levels (100%). After bleaching (8 s), fluorescence recovery was measured at 15-s intervals (A), and data fit to a one-phase exponential association equation to obtain diffusion coefficient (D) and immobile fraction. (B) Summary of immobile faction data derived from expression of YFP-S-S (58.9 ± 5.6%; n = 7 cells) or YFP-SH-S (23.2 ± 7.7%; n = 7 cells). (C) Diffusion coefficients derived for YFP-S-S (7.9 ± 1.9 µm2/s × 10−3; n = 7 cells) or YFP-SH-S (17.1 ± 3.0 µm2/s × 10−3; n = 7 cells). (D–F) Results obtained as in A–C except using HEK Orai1–CFP cells. (E) Summary of immobile fraction derived for YFP-S-S (23.7 ± 3.6%; n = 8 cells) or YFP-SH-S (15.7 ± 3.2%; n = 6 cells). (F) Diffusion coefficients derived for YFP-S-S (15.3 ± 4.5 µm2/s × 10−3, n = 8 cells) or for YFP-SH-S (15.9 ± 4.6 µm2/s ×10−3; n = 6 cells). (G) Comparison of ICRAC normalized to YFP intensity measured in stable HEK Orai1–His cells expressing either YFP-S-S or YFP-SH-S. (H) Summary of peak currents generated in HEK Orai–His cells by YFP-S-S and YFP-SH-S. Currents are normalized to YFP intensity and expressed as a fraction of the mean current (normalized ICRAC) measured with YFP-S-S in HEK Orai1–His cells. The value for YFP-S-S is 1.00 ± 0.14 (n = 12 cells), and for YFP-SH-S is 0.43 ± 0.04 (n = 15 cells). (I) Comparison of YFP-normalized ICRAC measured in stable HEK Orai1–CFP cells expressing either YFP-S-S or YFP-SH-S. (J) Summary of peak currents generated in HEK Orai–CFP cells by YFP-S-S and YFP-SH-S. Currents are normalized to YFP intensity and expressed as a fraction of the mean current (normalized ICRAC) measured with YFP-S-S in Orai1–His cells. The value for YFP-S-S is 0.62 ± 0.06 (n = 15 cells) and for YFP-SH-S, 0.71 ± 0.05 (n = 14 cells). Representative traces are shown for A, D, G, and I, and summary data include means ± SEM for the number of cells shown. Representative FRAP traces are from three independent experiments; current traces are representative of four independent experiments. All data are presented as means ± SEM. **P < 0.01.

