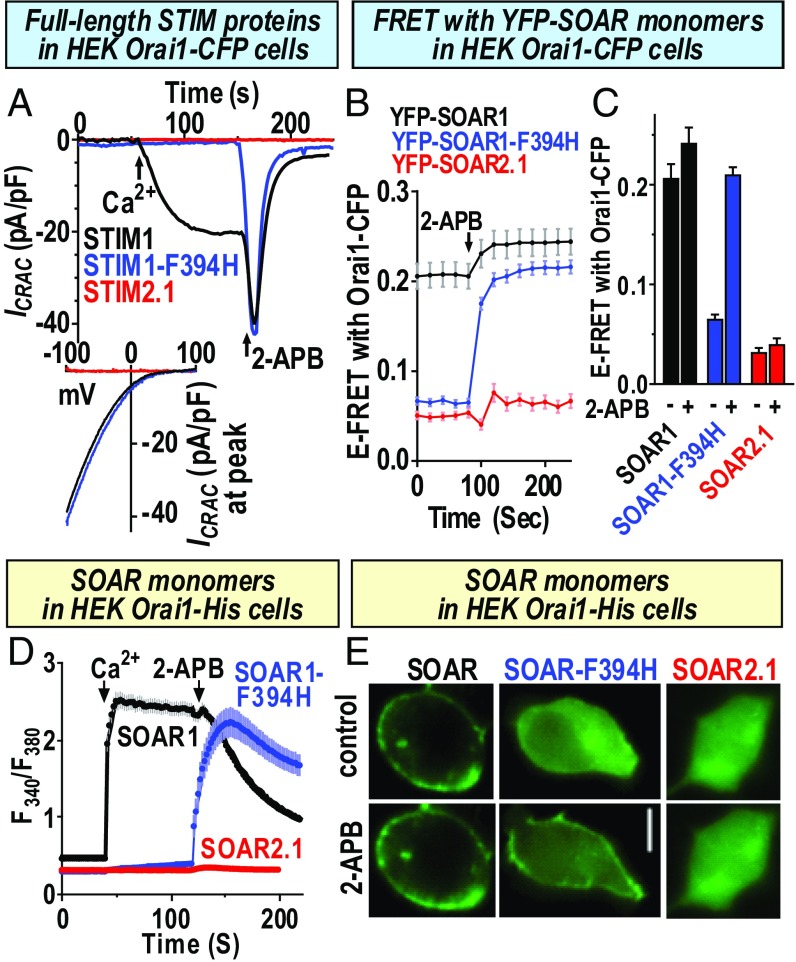
Fig. 3.
Comparison of the function of full-length STIM1, STIM1–F394H, and STIM2.1, and the SOAR fragments derived therefrom. (A) ICRAC measurements in HEK Orai1–CFP cells transiently expressing either STIM1, STIM–F394H, or STIM2.1. Stores were passively depleted with 10 mM BAPTA in the pipette and 20 mM Ca2+ bath solution, and 50 μM 2-APB was added as shown. (B) E-FRET was measured in HEK Orai1–CFP cells expressing either YFP–SOAR1, YFP–SOAR1–F394H, or YFP–SOAR2.1. Basal values and values after 50 μM 2-APB addition were obtained and summarized in C. (C) SOAR1 (basal, 0.207 ± 0.014; after 2-APB, 0.242 ± 0.015; n = 42 cells), YFP–SOAR1–F394H (basal, 0.066 ± 0.004; after 2-APB, 0.210 ± 0.007; n = 43 cells), and YFP–SOAR2.1 (basal, 0.032 ± 0.005; after 2-APB, 0.040 ± 0.006; n = 34 cells). Summary data from three separate transfections are shown (means ± SEM). (D) Ca2+ imaging in fura2-loaded HEK Orai1–His cells expressing YFP–SOAR1, YFP–SOAR1–F394H, or YFP–SOAR2.1. Constitutive Ca2+ entry was measured following addition of 1 mM extracellular Ca2+ and 50 μM 2-APB as shown. (E) Fluorescence images showing the distribution of YFP–SOAR1, YFP–SOAR1–F394H, or YFP–SOAR2.1 expressed in HEK Oria1–His cells, either before (Top) or after (Bottom) addition of 50 μM 2-APB. (Scale bar, 10 μm.) Representative traces and images are from three independent experiments; data are means ± SEM.

