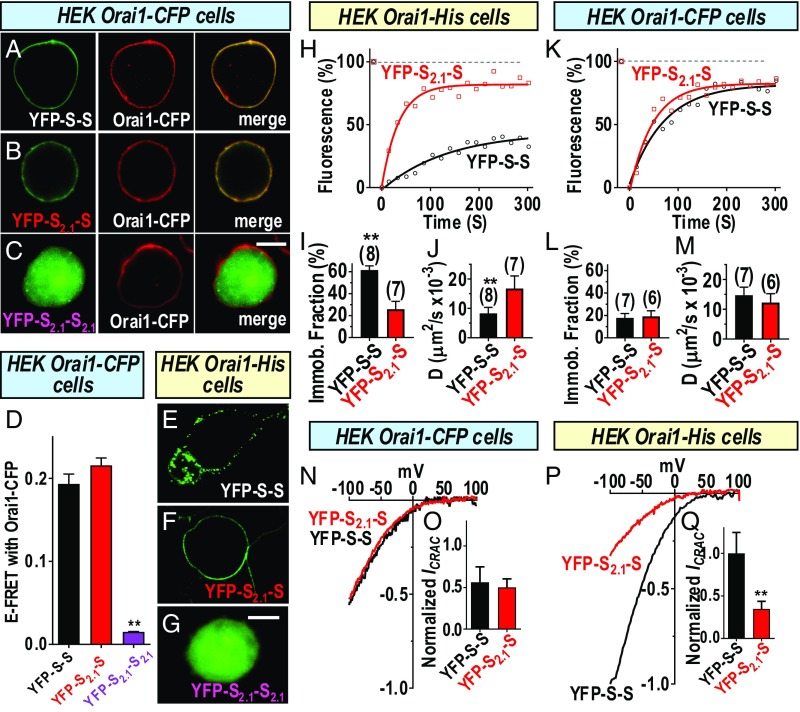
Fig. 4.
The SOAR2.1 heterodimer blocks cross-linking but not the functional coupling of Orai1 channels. Experiments compared the distribution and actions of the YFP-tagged concatenated SOAR heterodimer (YFP-S2.1-S) and homodimer (YFP-S2.1-S2.1) constructs (SI Appendix, Fig. S7) with the wild type of SOAR homodimer (YFP-S-S). Fluorescence images of YFP-S-S (A) or YFP-S2.1-S (B) expressed in HEK Orai1–CFP cells, revealing close overlap of YFP–SOAR and Orai1–CFP in the merged images. In contrast, YFP-S2.1-S2.1 (C) does not associate with Orai1. (D) FRET between YFP–SOAR dimers expressed in HEK Orai1–CFP cells shows strong FRET between Orai1–CFP and YFP-S-S (0.193 ± 0.012; n = 21 cells) or YFP-S2.1-S (0.216 ± 0.009; n = 15 cells), but almost no FRET with YFP-S2.1-S2.1 (0.015 ± 0.001; n = 16 cells). YFP-S-S expressed in HEK Orai1–His cells is clearly clustered (E), whereas YFP-S2.1-S has a smooth nonclustered distribution on the PM (F), and YFP-S2.1-S2.1 does not associate with Orai1 in the PM (G). (H–J) FRAP measurements for YFP-S-S and YFP-S2.1-S dimers expressed in HEK Orai1–His cells. (H) Time dependence of fluorescence compared with levels before the 8-s bleaching period (100%). (I) Summary of fraction of immobile fluorescence from FRAP data for YFP-S-S (25.7 ± 7.3%; n = 7 cells) or YFP-S2.1-S (61.4 ± 3.8%; n = 8 cells). (J) Summary of diffusion coefficient (D) measurements derived from FRAP data for YFP-S-S (8.3 ± 2.0 µm2/s ×10−3; n = 8 cells) or YFP-S2.1-S (16.8 ± 4.3 µm2/s ×10−3; n = 7 cells). (K–M) FRAP measurements for YFP-S-S and YFP-S2.1-S dimers expressed in HEK Orai1–CFP cells. (K) Time dependence of fluorescence compared with levels before the 8-s bleaching period (100%). (L) Summary of fraction of immobile fluorescence from FRAP data for YFP-S-S (17.7 ± 4.0%; n = 7 cells) or YFP-S2.1-S (19.2 ± 5.0%; n = 6 cells). (M) Summary of diffusion coefficient (D) measurements derived from FRAP data for YFP-S-S (14.7 ± 2.7 µm2/s ×10−3; n = 7 cells), or YFP-S2.1-S (12.2 ± 3.0 µm2/s ×10−3; n = 6 cells). (N) Comparison of ICRAC measured in HEK Orai1–CFP cells expressing either YFP-S-S or YFP-SH-S. (O) Summary of peak currents generated in HEK Orai–CFP cells by YFP-S-S (0.56 ± 0.19; n = 6) or YFP-S2.1-S (0.50 ± 0.10; n = 7 cells). (P) ICRAC in HEK Orai1–His cells expressing either YFP-S-S or YFP-S2.1-S. (Q) Summary of peak currents generated in HEK Orai–His cells by YFP-S-S (1.00 ± 0.25; n = 15 cells) or YFP-S2.1-S (0.35 ± 0.09; n = 6 cells). In each case, currents were normalized to YFP intensity and expressed as a fraction of the mean current (normalized ICRAC) measured with YFP-S-S in Orai1–His cells. Representative traces from three independent experiments are shown for H, K, N, and P; summary data are means ± SEM for cell numbers shown. **P < 0.001. [Scale bars, C and G, 10 μm (also apply to A and B and E and F, respectively).]

