Fig. 5.
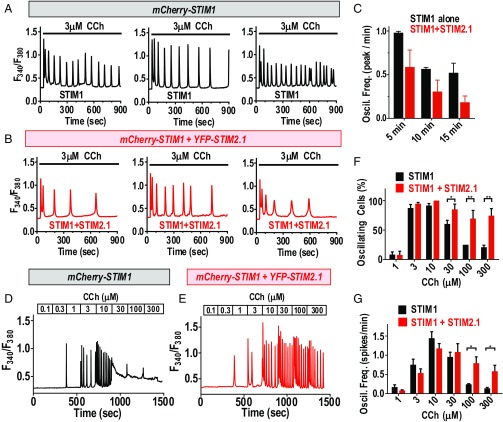
Modulation of agonist-induced Ca2+ oscillations by STIM2.1. Ca2+ oscillatory responses to carbachol were measured in CRISPR-derived HEK cells devoid of endogenous STIM1 and STIM2 (HEK S1S2–dKO cells). (A) Representative Ca2+ responses to 3 μM carbachol measured in HEK S1S2–dKO cells transfected with mCherry–STIM1. (B) Ca2+ responses to 3 μM carbachol measured in HEK S1S2–dKO cells transfected with mCherry–STIM1 together with YFP–STIM2.1. (C) Summary data for the time dependence of oscillations in response to 3 μM carbachol in HEK S1S2–dKO cells expressing STIM1 alone (black; n = 35 cells) or STIM1 together with STIM2.1 (red; n = 44 cells). (D and E) Representative traces of Ca2+ oscillatory responses to a range of carbachol levels sequentially added to HEK S1S2–dKO expressing either mCherry–STIM1 alone (D) or mCherry–STIM1 together with YFP–STIM2.1 (E). (F) Summary data from multiple cells of the fraction of cells giving oscillatory responses at each carbachol concentration shown. (G) Summary from multiple cells of the frequency of Ca2+ oscillations observed in response to the range of carbachol shown. For both F and G, data are the summary from 66 cells expressing mCherry–STIM1 alone (black), and 52 cells expressing mCherry–STIM1 together with YFP–STIM2.1 (red), in each case derived from three separate transfections. For all experiments shown, the level of mCherry–STIM1 expression was the same, both in the presence or absence of YFP–STIM2.1 (SI Appendix, Fig. S9 A–D). In cells transfected with both mCherry–STIM1 and YFP–STIM2.1, the ratio of STIM1 to STIM2.1 was 5:1, as determined in SI Appendix, Fig. S9. Representative traces are from four independent experiments. Summary data shown are means ± SEM; *P < 0.01; **P < 0.001.

