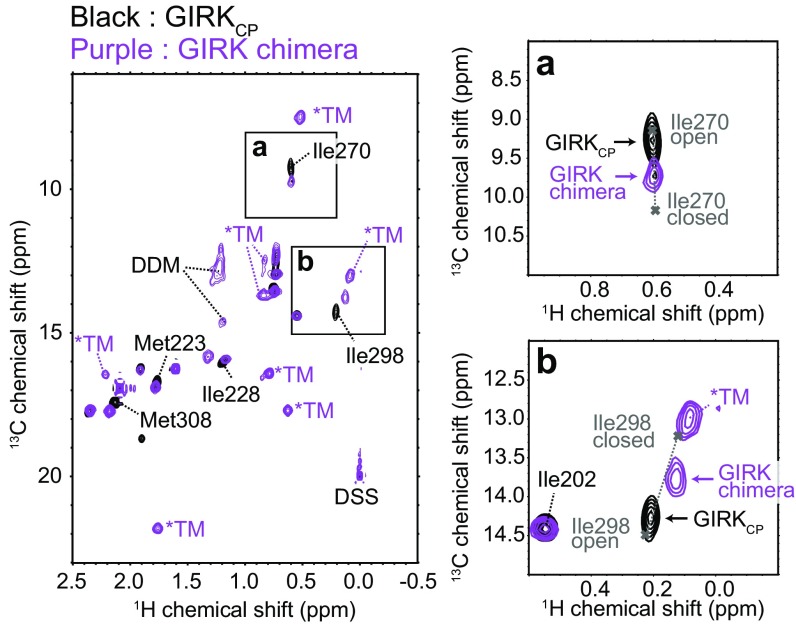
Fig. 4.
NMR analyses of the GIRK chimera. Overlay of 1H–13C HMQC spectra of {u-[2H]; Ileδ1, Metε-[13CH3]} GIRKCP (black) and {u-[2H]; Ileδ1, Metε-[13CH3]} GIRK chimera (purple). The signals from the TM region are labeled with asterisks, and the signals with chemical shift differences are labeled. The close-up views of the 1H–13C HMQC signals of Ile270 (A) and Ile298 (B) are shown. Cross marks denote the chemical shifts of the open and closed states, which were calculated using the exchange parameters from the MQ CPMG RD and methyl-HDR analyses.

