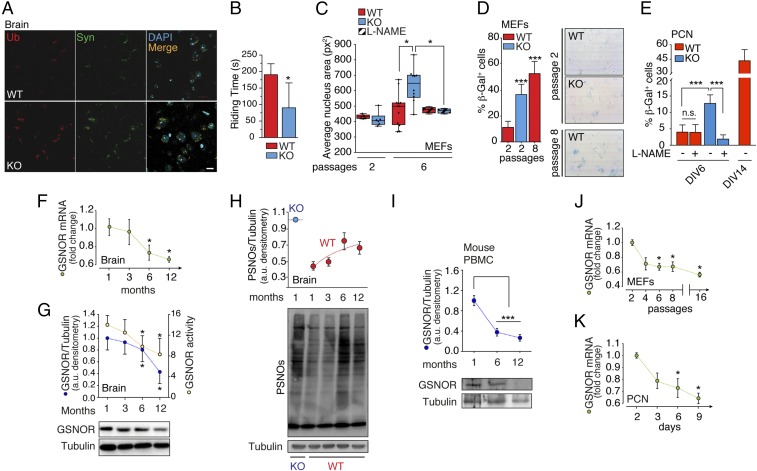
Fig. 1.
GSNOR decrease is associated with age and cell senescence. (A) Immunofluorescence analyses of brain cortexes from 2-mo-old WT and Gsnor−/− (KO) mice incubated with antiubiquitin (Ub, red) and anti–α-synuclein (Syn, green) antibodies. DAPI was used to stain nuclei. Ub spot count per field = 30.67 ± 4.17 (WT); 62.67 ± 8.67 (KO); average Syn spot count per field = 33.67 ± 6.96 (WT); 64.67 ± 6.96 (KO). Values represent mean ± SEM of n = 3 fields containing ∼35 cells per field. (Scale bar: 10 μm.) (B) Rotarod test. Values are expressed as latency to fall off the rod (riding time) and represent mean ± SEM of 2-mo old WT (n = 5) and KO (n = 5) mice, respectively, analyzed at three different times. *P < 0.05 (Student’s t test). (C) Nuclear size evaluated in WT and KO MEFs after two and six passages in culture in the presence or lack of 500 μM L-NAME added every 48 h. Size is expressed as squared pixels (px2). Values represent mean ± SEM of n ≥ 6 independent experiments. *P < 0.05 (Student’s t test). β-Galactosidase (β-Gal) activity of WT and KO MEFs (D) and PCNs (E) is shown. Values represent mean ± SEM of n = 3 independent experiments performed in duplicate. ***P < 0.001 (Student’s t test). DIV, days in vitro. (F) Real-time PCR analysis of GSNOR expression in brain from WT mice 1 to 12 mo of age. Actin and the ribosomal protein L34 were used as internal standards. Values represent mean ± SEM of n = 5 animals per experimental point analyzed in triplicate. *P < 0.05 (Student’s t test). (G) GSNOR activity and protein levels in brain homogenates from WT mice from 1 to12 mo of age. Results of GSNOR immunoreactive band densitometry (relative to tubulin) and enzymatic activity (expressed as nanomoles of NADH × milligrams of protein−1 × min−1) are shown and represent mean ± SEM of n ≥ 3 animals per experimental point analyzed in duplicate. *P < 0.05 (Student’s t test). (H) Amount of PSNOs in the brain from WT and KO mice from 1 to 12 mo of age. Results of PSNO densitometry (relative to tubulin) are shown. Values represent mean ± SD of n = 3 animals for each experimental point. (I) Western blot analysis of GSNOR in PBMCs from WT mice 1 to 12 mo of age. Results of band densitometry (relative to tubulin) are shown. Values represent mean ± SD of n = 3 animals for each experimental point. ***P < 0.001 (Student’s t test). Real-time PCR analysis of GSNOR expression in MEFs (J) and PCNs (K) is shown. L34 was selected as an internal standard, and values are expressed as fold change relative to cells maintained in culture for two passages (MEFs) or 2 d (PCNs). Values represent mean ± SEM of n = 3 independent experiments performed in triplicate. *P < 0.05 (Student’s t test).

