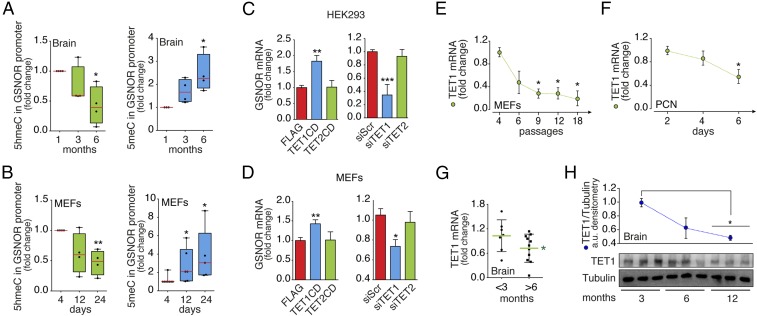
Fig. 2.
Age-dependent GSNOR expression is regulated by DNA methylation and controlled by TET1. Real-time PCR analyses of (5hmeC, green) and (5meC, blue) levels in the Gsnor promoter in the mouse brain (A) and MEFs (B) are shown. Values are expressed as fold change relative to 1-mo-old WT brains or MEFs maintained in culture for four passages, and represent mean ± SEM of n ≥ 4 independent experiments performed in quadruplicate. *P < 0.05; **P < 0.01 (Student’s t test). Real-time PCR analyses of GSNOR expression in HEK293 cells (C) and WT MEFs (D) transfected with either catalytic domains or siRNA for TET1 and TET2 are shown. Values represent mean ± SEM of n = 3 independent experiments performed in duplicate. *P < 0.05; **P < 0.01; ***P < 0.001 (Student’s t test). Real-time PCR analyses of TET1 expression in WT MEFs (E) and PCNs (F) maintained in culture for up to 18 passages or 6 d, respectively, as well as in brains obtained from WT mice of different ages, are shown. (G) Values are normalized on actin, and represent mean ± SEM of n = 3 independent experiments (MEFs and PCNs) and n ≥ 6 animals (mouse brain) performed in triplicate. *P < 0.05 (Student’s t test). (H, Bottom) Western blot analysis of TET1 in brain homogenates from WT mice in a range from 3 to 12 mo of age. (H, Top) Results of band densitometry (relative to tubulin) are shown. Values represent mean ± SD of n = 3 animals per age. *P < 0.05 (Student’s t test). CD, catalytic domain.

