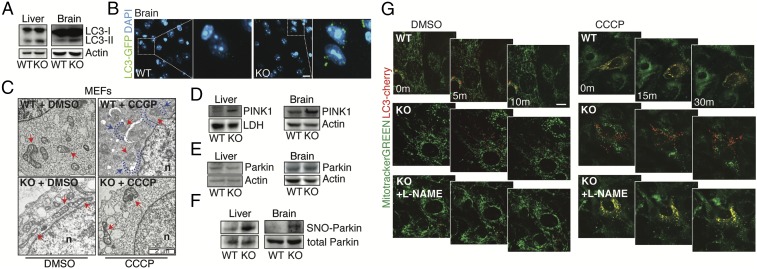
Fig. 5.
Gsnor−/− cells show defects in mitophagy linked to S-nitrosylation. (A) Representative Western blot of LC3 in brain and liver homogenates obtained from 2-mo old WT and Gsnor−/− (KO) mice. Actin was used as a loading control. (B, Left) Brain slices (i.e., cerebral cortex) obtained from Lc3+/GFP:Adh5+/+ (2) and Lc3+/GFP:Adh5−/− (KO) mice analyzed by fluorescence microscopy to visualize autophagosomes. DAPI was used to visualize nuclei. (B, Right) Digital magnification is shown. (Scale bar: 10 μm.) (C) Transmission electron microscopy images of WT and KO MEFs treated for 6 h with CCCP or vehicle (DMSO). Nuclei (n) and mitochondria (red arrows) are indicated, along with internal double-membraned structures surrounding mitochondria (phagophores, blue dotted lines and arrows). Representative Western blots of PINK1 (D) and Parkin (E) in brain and liver total extracts obtained from 2-mo old WT and KO mice are shown. LDH or actin was used as a loading control. (F) Western blot analysis of SNO-Parkin performed on PSNOs obtained from liver and brain lysates of WT and KO mice. Western blot analysis of total Parkin is shown as a control. (G) Representative frames captured upon live-imaging fluorescence microscopy (Movies S1–S6) of mitochondrial networks in WT and KO MEFs expressing the fluorescent protein LC3-cherry (red) and stained with MitoTracker Green (green) to visualize autophagosomes and mitochondria, respectively. MEFs were pretreated with 0.5 mM L-NAME (where indicated) or with the vehicle solution for 1 wk with administration every 48 h. CCCP was added before image acquisition to induce mitophagy. m, minute(s). (Scale bar: 10 μm.)

