Fig. 2.
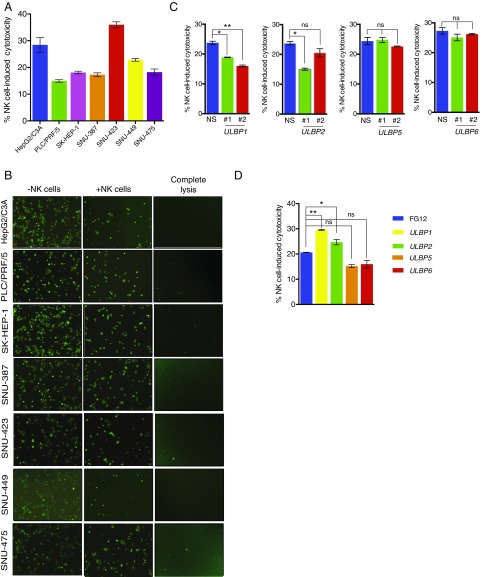
NK cells exhibit differences in the ability to eradicate HCC. (A) HCC cell lines were incubated with NK cells in a 96-well plate at a 20:1 NK cell:cancer cell ratio. After incubating for 2 h, the supernatants were collected and LDH activity was measured. The percentage (%) of NK cell-induced cytotoxicity was calculated and plotted. (B) The cells were stained with Calcein AM and seeded with NK cells in 96-well plates at a 10:1 NK cell:cancer cell ratio. After incubation for 4 h, fluorescent images were captured using an inverted microscope. Images of indicated HCC cell lines showing loss of fluorescent cells (live cells) are presented. Calcein AM-stained cancer cells without NK cells served as the control. (C) HepG2 cells expressing shRNAs against ULBP1, -2, -5, or -6 and control nonspecific shRNAs were analyzed for NK cell cytotoxicity using an LDH activity cytotoxicity assay. The percentage (%) of NK cell-induced cytotoxicity in HepG2 cells was calculated and plotted for the indicated shRNAs. (D) ULBP1, -2, -5 or -6 ligands were ectopically expressed in SK-HEP-1 cells and analyzed for NK cell-mediated cytotoxicity using an LDH activity-based cytotoxicity assay. FG12 vector-transfected cells served as the negative control. The percentage (%) of NK cell-induced cytotoxicity in SK-HEP-1 cells was calculated and plotted for the indicated vector or ligand. Data are presented as mean ± SEM; ns, not significant; *P < 0.05; and **P < 0.01.

