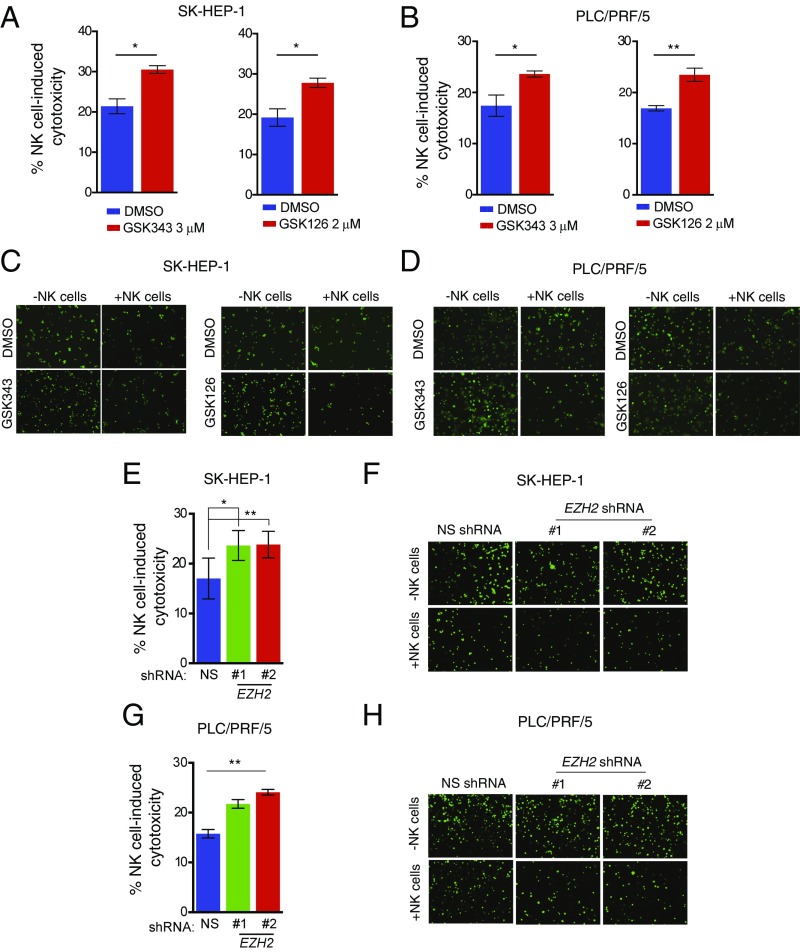
Fig. 4.
Pharmacological and genetic inhibition of EZH2 enhances NK cell-mediated cytotoxicity against HCC cells. (A) SK-HEP-1 cells were treated with DMSO or the EZH2 inhibitors GSK343 (3 μM) or GSK126 (2 μM) for 48 h and incubated with NK cells at a ratio of 20:1. The percentage (%) of NK cell-induced cytotoxicity was calculated and plotted. (B) PLC/PRF/5 cells were treated with DMSO or the EZH2 inhibitors GSK343 (3 μM) or GSK126 (2 μM) for 48 h and incubated with NK cells at a ratio of 20:1. The percentage (%) of NK cell-induced cytotoxicity was calculated and plotted. (C) SK-HEP-1 cells were treated with DMSO or the EZH2 inhibitors GSK343 (3 μM) or GSK126 (2 μM) for 48 h, stained with Calcein AM, and incubated with NK cells at a ratio of 10:1. At 4 h post incubation, fluorescent images were captured using an inverted microscope. Images depicting the loss of fluorescent cells (live cells) under the indicated conditions are presented. Calcein AM-stained cancer cells without NK cells served as a negative control. (D) PLC/PRF/5 cells were treated with DMSO or the EZH2 inhibitors GSK343 (3 μM) or GSK126 (2 μM) for 48 h, stained with Calcein AM, and incubated with NK cells at a ratio of 10:1. At 4 h post incubation, fluorescent images were captured using an inverted microscope. Images depicting the loss of fluorescent cells (live cells) under the indicated conditions are presented. Calcein AM-stained cancer cells without NK cells served as the negative control. (E) SK-HEP-1 cells expressing NS or EZH2 shRNAs were analyzed for NK cell-induced cytotoxicity following incubation with NK cells at a ratio of 20:1. The percentage (%) of NK cell-induced cytotoxicity was calculated and plotted. (F) SK-HEP-1 cells expressing NS or EZH2 shRNAs were stained with Calcein AM and incubated with NK cells at a ratio of 10:1. Fluorescent images were captured 4 h post incubation using an inverted microscope. Images depicting the loss of fluorescent cells under the indicated conditions (live cells) are presented. Calcein AM-stained cancer cells without NK cells served as a negative control. (G) PLC/PRF/5 cells expressing NS or EZH2 shRNAs were analyzed for NK cell-induced cytotoxicity by incubation with NK cells at a ratio of 20:1. The percentage (%) of NK cell-induced cytotoxicity was calculated and plotted. (H) PLC/PRF/5 cells expressing NS or EZH2 shRNAs were stained with Calcein AM and incubated with NK cells at a ratio of 10:1. Fluorescent images were captured 4 h post incubation using an inverted microscope. Images depicting the loss of fluorescent cells (live cells) under the indicated conditions are presented. Calcein AM-stained cancer cells without NK cells served as a negative control. Data are presented as mean ± SEM; *P < 0.05 and **P < 0.01.

